Price Action Trading: Stop Guessing, Start Reading the Market

Imagine you are driving and suddenly see a road sign saying “Sharp Turn Ahead.” You do not need to know the entire history of the road to slow down and prepare. The sign gives you useful information about what may happen next.
Price action works in a similar way.
Instead of depending heavily on indicators, price action traders study what the market is doing directly through candlesticks, support and resistance, trends, breakouts, rejections and market structure.
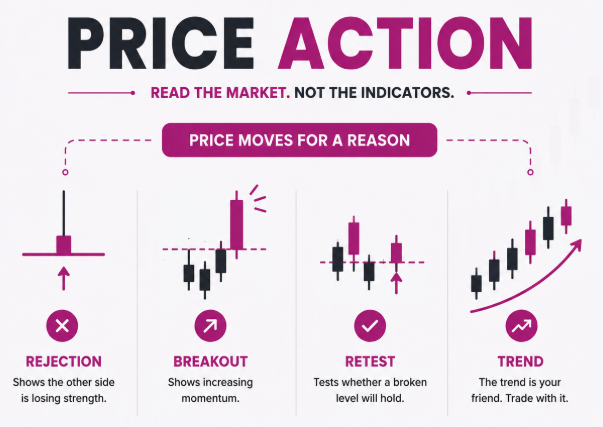
What Is Price Action?
Price action is simply the study of how price moves over time.
For example, imagine Gold is trading around $4,400 and has repeatedly fallen whenever it reaches $4,500. Traders may identify $4,500 as resistance.
If Gold approaches $4,500 again and forms a strong bearish rejection candle, the price itself is telling traders:
“Buyers are struggling to push higher.”
A trader may then look for confirmation before considering a short trade.
On the other hand, if Gold breaks above $4,500 with strong momentum and later holds that level as support, the message changes:
“Buyers may now be in control.”
That is the beauty of price action: the chart tells a story.
The Supermarket Example
Imagine you walk into a supermarket and notice that every time a particular product is placed on sale, customers rush to buy it.
After observing this several times, you begin to recognize a pattern. Trading is similar.
A price level where buyers repeatedly enter can act like a support zone, while an area where sellers repeatedly appear can act like resistance.
You are not predicting the future with certainty. You are using previous market behaviour to make a more informed decision.
Why Do Traders Struggle With Price Action?
1. They See Too Many Patterns
One trader sees a bullish engulfing candle. Another sees a pin bar. Someone else sees a breakout.
The problem is that traders can become obsessed with finding patterns everywhere.
Solution:
Do not trade a candle pattern in isolation. Combine price action with market structure, key levels, trend direction and confirmation.
A bullish candle at strong support means more than the same candle appearing in the middle of nowhere.
2. They Enter Too Early
Imagine EUR/USD reaches resistance. A trader immediately opens a sell position because they believe price must fall. But price breaks through resistance instead.
Solution:
Wait for confirmation.
Look for things such as:
- A clear rejection
- A break of structure
- A confirmed breakout
- A retest of a broken level
- Strong momentum in the expected direction
Sometimes the best trade is the trade you wait for.
3. They Think Every Breakout Will Continue
Price breaks resistance and a trader immediately buys. Five minutes later, price falls back below the level.
This is known as a false breakout.
Solution:
Ask yourself: Did price actually accept the new level?
Instead of chasing the first breakout candle, traders can wait for a close above the level and depending on their strategy, a possible retest before entering.
4. They Ignore the Bigger Picture
A trader sees a bullish pattern on a 5-minute chart and buys. But on the 4-hour chart, the market is clearly in a strong downtrend. The small bullish move may simply be a temporary pullback.
Solution:
Use multiple timeframes.
For example:
4H: Identify the overall trend.
1H: Identify important levels and structure.
15M: Look for an entry setup.
The lower timeframe should support the bigger picture rather than completely contradict it.
5. They Believe Price Action Gives Perfect Predictions
This is one of the biggest mistakes. Price action does not tell you exactly what will happen next. A beautiful setup can still lose.
Solution:
Think in terms of probabilities, not certainty.
Instead of saying:
“Gold will definitely go up.”
Think:
“If price holds this support and confirms bullish structure, the probability of an upward move may increase.”
That small change in thinking can dramatically improve trading discipline.
Price Action + Risk Management
Good price action without risk management can still produce bad results.
Imagine a trader has a strategy that wins 60% of the time but risks $100 to make only $20.
Five losses could easily wipe out many previous wins.
Now imagine another trader wins only 45% of trades but risks $50 to potentially make $100.
The second trader may still be profitable.
Therefore, price action should work together with:
Entry + Stop Loss + Take Profit + Position Size + Risk Management
A Simple Price Action Framework
Before entering a trade, ask five questions:
1. What is the trend?
Is the market bullish, bearish or ranging?
2. Where is price?
Is price near support, resistance or an important supply/demand area?
3. What is price doing there?
Is it rejecting, breaking, consolidating or reversing?
4. Do I have confirmation?
Has the market actually shown evidence supporting my idea?
5. What is my risk?
Where is the stop loss, and does the potential reward justify the risk?
If you cannot answer these questions clearly, there may be no reason to enter.
Final Takeaway
The key to price action trading is not memorising countless candlestick patterns, but understanding what price movements reveal about buyers and sellers. Rejections can signal weakening momentum, breakouts can show strength, retests can confirm whether a level is holding, while higher highs and higher lows indicate bullish structure and lower highs and lower lows suggest bearish structure.
The more you understand these market signals, the less you rely on guesswork. Successful trading is not about being right every time; it is about identifying quality setups, managing risk, controlling emotions and waiting for price to confirm your idea before taking action. The market is always communicating through price—the real skill is learning how to read it.