Weekly Market Outlook : Gold Surges Above $4,600, Oil Climbs 5%, Bitcoin Jumps 20% & Nasdaq 100 Drops 2.45% — What’s Next This Week?

Introduction
Markets delivered powerful moves last week, with NZD/USD surging 1.57%, Gold gaining 5.2%, Silver jumping 6.7%, Bitcoin rallying over 20%, while the Nasdaq 100 fell 2.45%. As a new week begins, traders face key opportunities across Forex, commodities, crypto, stocks and indices, with major events including U.S. Core PCE and Canada GDP. Explore this week’s key market levels, high-probability setups and potential breakout opportunities.
Previous Week’s Important Events and Impact:
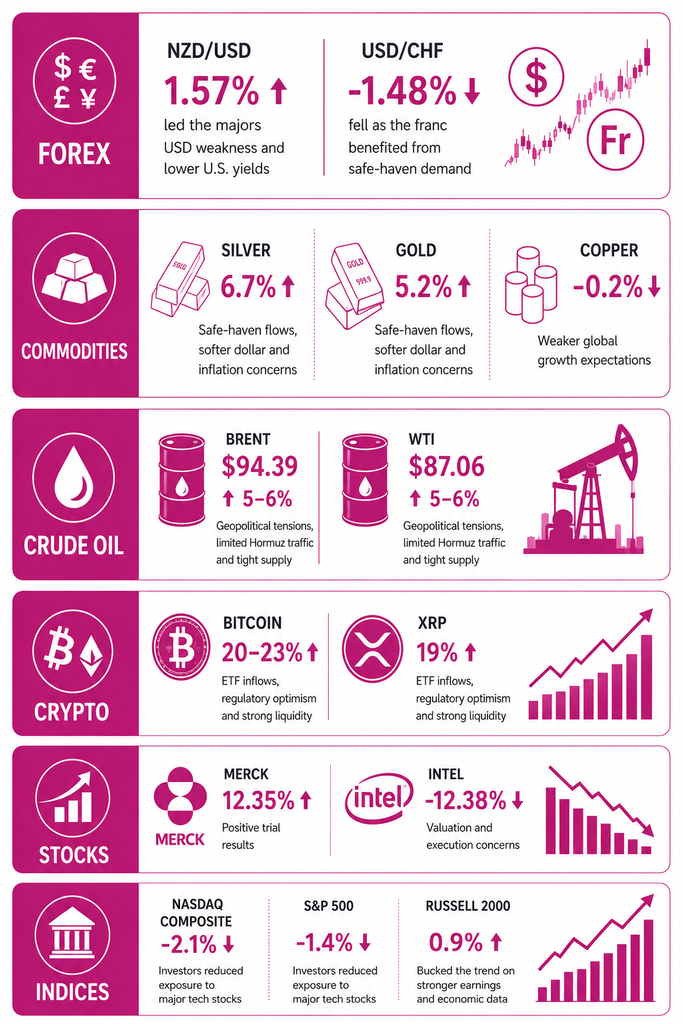
Forex: NZD/USD emerged as the strongest major pair last week, advancing 1.57% as broad U.S. dollar weakness, softer American economic figures, lower Treasury yields, and demand for higher-return currencies boosted the pair. Meanwhile, USD/CHF fell 1.48%, making it the weakest performer, as the dollar lost ground and investors increased exposure to the Swiss franc as a safe haven.
Commodities: Silver (XAG/USD) and Gold (XAU/USD) recorded the strongest gains among major commodities, climbing approximately 6.7% and 5.2%, respectively. The rally was fueled by safe-haven flows, fiscal uncertainty, central-bank buying, a weaker dollar and easing inflation pressures. Copper (XCU/USD) edged lower by around 0.2%, weighed down by concerns about economic growth and demand in the U.S. and China.
Crude Oil: Oil prices advanced significantly during August 17–21, 2026, with Brent (XBR/USD) gaining roughly 5–6% to about $94.39, while WTI (XTI/USD) climbed to approximately $87.06. Supply concerns linked to limited Strait of Hormuz traffic, stalled U.S.–Iran discussions, rising geopolitical risks, and tight inventories supported the rally.
Crypto: Bitcoin (BTC) and XRP were among the strongest performers, rising approximately 20–23% and 19% respectively. Improved market liquidity, positive regulatory developments, strong ETF demand and a significant short squeeze helped drive the gains, while smaller altcoins such as GoPlus Security (GPS) struggled as investors shifted funds toward larger cryptocurrencies.
Stocks: Merck (MRK) led the stock market gainers, jumping 12.35% following encouraging Phase 3 trial results involving Moderna, which strengthened optimism around its cancer-treatment pipeline. In contrast, Intel (INTC) dropped 12.38%, pressured by concerns surrounding execution, possible dilution, semiconductor valuations and elevated Treasury yields.
Indices: The Nasdaq Composite suffered the steepest decline among major indices, losing 2.1%, while the S&P 500 slipped 1.4%. Profit-taking across AI and mega-cap technology shares, higher Treasury yields and renewed inflation worries linked to elevated oil prices and Middle East tensions weighed on sentiment. Conversely, the Russell 2000 gained 0.9% toward the end of the week as improving economic data and corporate earnings supported a shift into small-cap and value stocks.
Important Events This Week:
FOREX : USDCAD
This week, market participants will focus on two major data releases: the U.S. Core PCE Price Index, expected to rise 0.3%, scheduled for Wednesday, August 26, 2026, at 12:30 PM GMT, after June’s softer-than-forecast 0.1% monthly gain, with annual core inflation at 3.3% and Canada’s GDP Growth Rate, projected at 0.8%, due Friday, August 28, 2026, at 12:30 PM GMT following a 0.2% contraction in Q1 2026 versus expectations for 0.3% growth.
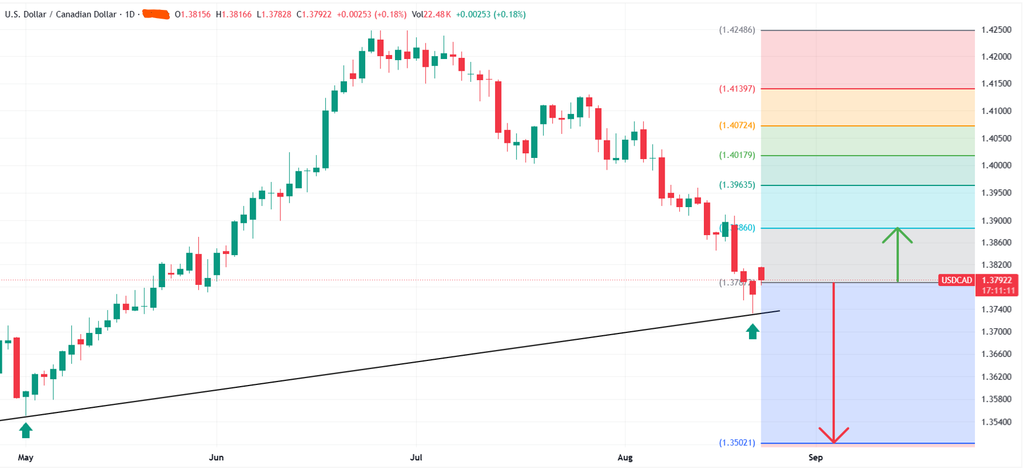
The chart shows price testing a rising trendline support around 1.3740 – 1.3760, so the high-probability BUY setup is Buy Stop 1.3810, SL 1.3740, TP 1.39635, giving approximately 1:2.2 RR. Alternatively, if support fails, the SELL setup is Sell Stop 1.3735, SL 1.3810, TP 1.35021, giving approximately 1:2.9 RR. Bias: bullish above 1.3740, bearish on a confirmed daily break below 1.3740.
METALS : XAUUSD ( GOLD )
Gold climbed over 5% last week, breaking above $4,600 per ounce to hit its highest level in three months, fueled by dollar weakness, declining U.S. bond yields and growing concerns over America’s fiscal position.
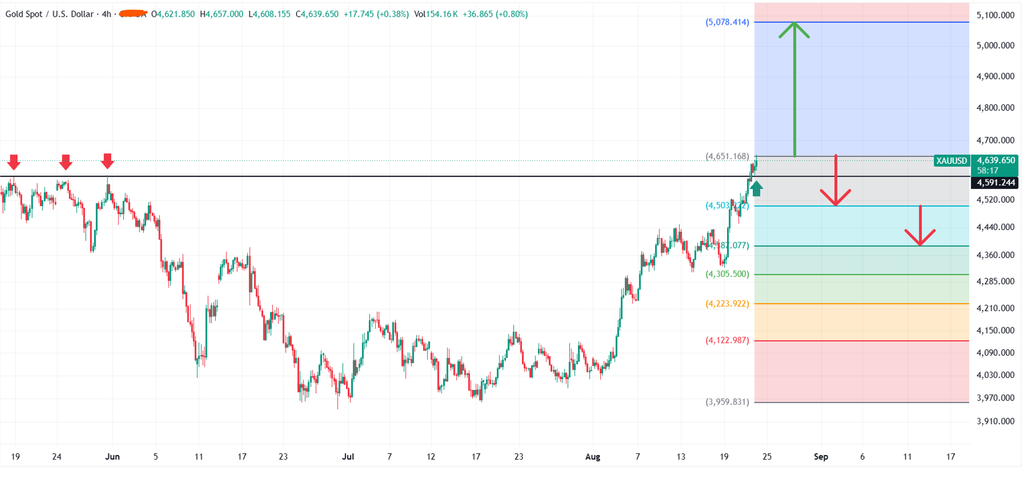
The chart shows price testing resistance around 4,651, so the high-probability BUY setup is Buy Stop 4,660, SL 4,591, TP 5,078, giving approximately 1:6 RR. Alternatively, if resistance holds, the SELL setup is Sell Stop 4,645, SL 4,690, TP 4,504, giving approximately 1:3.1 RR. Bias: bullish above 4,651, bearish on a confirmed break below 4,591.
ENERGY : USOIL
USOIL (WTI) surged toward 86–94 per barrel, driven by heightened Middle East risks, supply concerns around the Strait of Hormuz, and stricter U.S. measures against Iran, before retreating modestly as investors took profits.
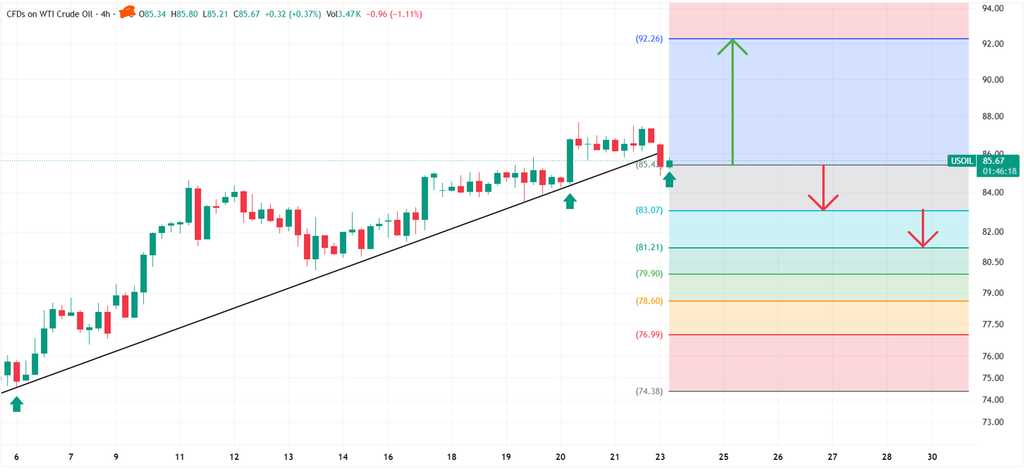
The chart shows price testing rising trendline support around 85.44, so the high-probability BUY setup is Buy Stop 85.80, SL 85.20, TP 92.26, giving approximately 1:10.8 RR. Alternatively, if support fails, the SELL setup is Sell Stop 85.30, SL 85.90, TP 83.07, giving approximately 1:3.7 RR. Bias: bullish above 85.44, bearish on a confirmed break below 85.44.
CRYPTO : BTCUSD ( BITCOIN )
Bitcoin surged by over 20% last week, jumping from approximately $62,800 to above $77,000, marking its biggest weekly advance in more than three years, driven by U.S. fiscal actions, political shifts and widespread position liquidations.
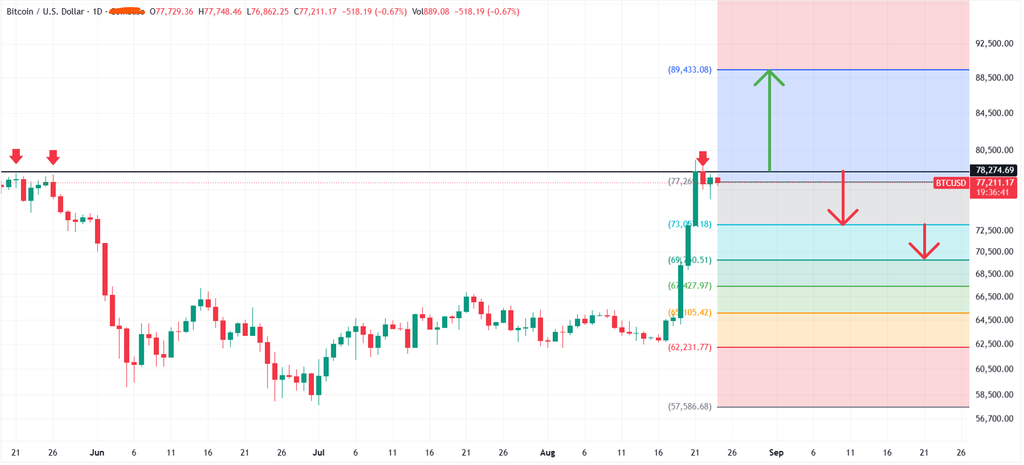
The chart shows price testing resistance around 78,274, so the high-probability BUY setup is Buy Stop 78,400, SL 77,200, TP 89,433, giving approximately 1:9.2 RR. Alternatively, if resistance holds and support breaks, the SELL setup is Sell Stop 77,000, SL 78,400, TP 73,051, giving approximately 1:2.8 RR. Bias: bullish above 78,274, bearish on a confirmed break below 77,000.
STOCKS : NVIDIA
Nvidia (NVDA) slipped slightly last week, closing Friday at $214.72, pressured by investor caution, rising Treasury yields, expectations surrounding its upcoming earnings, and sharply increasing memory-server expenses.
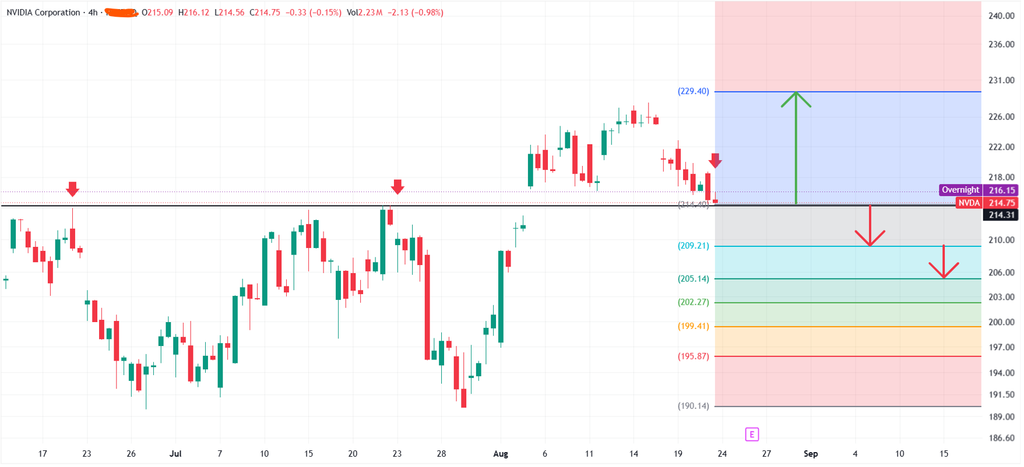
The chart shows NVIDIA testing key support around 214.48, so the high-probability BUY setup is Buy Stop 216.20, SL 209.21, TP 229.40, giving approximately 1:1.9 RR. Alternatively, if support breaks decisively, the SELL setup is Sell Stop 214.20, SL 218.20, TP 205.14, giving approximately 1:2.3 RR. Bias: bullish above 216.20 with a reclaim of 214.48–216.15, bearish on a confirmed break below 214.48.
INDICES : Nasdaq 100 Index
The Nasdaq 100 dropped about 2.45% last week, pressured by rising bond yields, a sharp semiconductor sell-off and cautious investor sentiment ahead of key earnings and economic events.
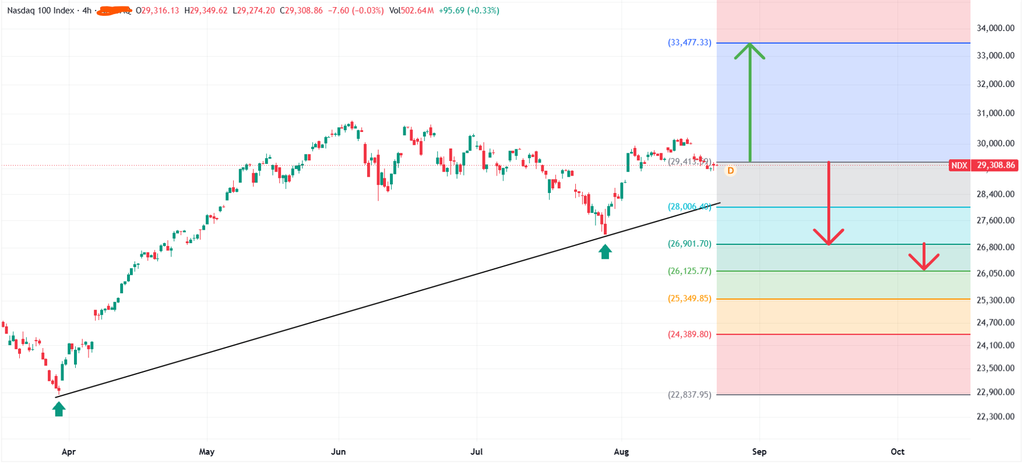
The chart shows price consolidating just below resistance around 29,414, so the high-probability BUY setup is Buy Stop 29,450, SL 28,006, TP 33,477, giving approximately 1:2.8 RR. Alternatively, if the support zone around 29,000 fails, the SELL setup is Sell Stop 28,950, SL 29,414, TP 26,902, giving approximately 1:4.4 RR. Bias: bullish above 29,414 with a confirmed breakout, bearish on a confirmed break below 29,000.