Weekly Market Outlook: 9th – 13th November 2026

Following last week’s mixed market performance, the U.S. dollar strengthened 0.3% to 102.30, gold rebounded 5.0% to $4,070, while WTI crude plunged 12.8% to $90.83 and Bitcoin retreated towards $75,800. U.S. equities also declined, with the S&P 500 falling 2.7% and Nasdaq losing 3.4%. This week, 9–13 November 2026, attention shifts to U.S. CPI on 10 November, UK GDP on 12 November, U.S. PPI on 13 November, OPEC’s oil report on 11 November and EIA inventories on 12 November. Investors will also monitor Fed speeches, geopolitical developments, crypto ETF flows and AI-sector sentiment ahead of NVIDIA’s 17 November earnings. These events could create significant volatility across forex, gold, oil, cryptocurrencies and global stocks.
Previous Week’s Market Recap
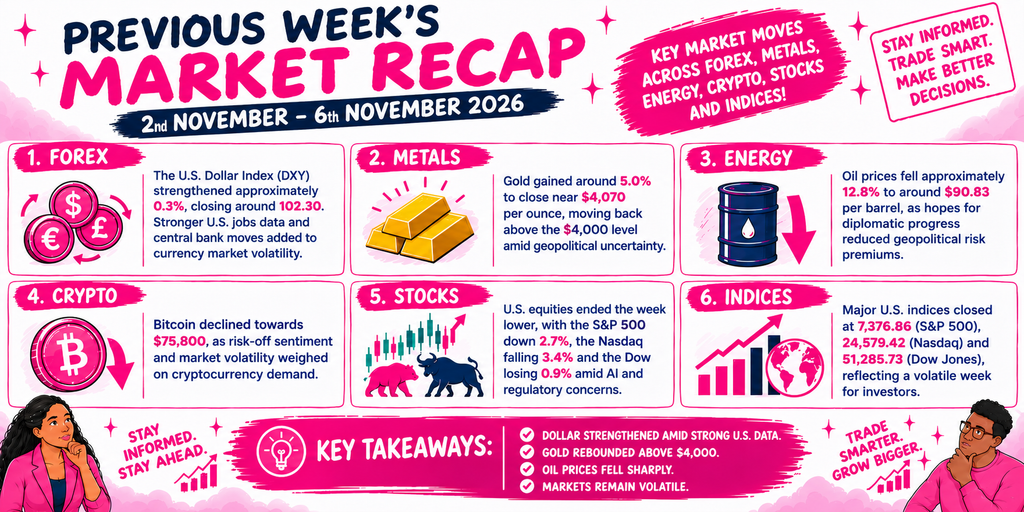
Forex:
The U.S. Dollar Index (DXY) strengthened approximately 0.3%, closing around 102.30. The dollar gained support from stronger-than-expected U.S. employment data, with October nonfarm payrolls increasing by 165,000 against expectations of 65,000. Meanwhile, the Bank of England and Reserve Bank of Australia raised interest rates, adding to currency market volatility.
Metals:
Gold recovered strongly, gaining approximately 5.0% to close around $4,070 per ounce. Prices moved back above the psychological $4,000 level as geopolitical uncertainty and changing expectations around U.S. monetary policy influenced demand for safe-haven assets.
Energy:
Oil prices recorded significant losses, with WTI crude falling approximately 12.8% to around $90.83 per barrel. Hopes for diplomatic progress between the United States and Iran reduced geopolitical risk premiums, while changing supply expectations contributed to the decline.
Crypto:
Bitcoin remained under pressure, declining towards $75,800 as risk-off sentiment, uncertainty surrounding technology stocks and broader market volatility weighed on cryptocurrency demand.
Stocks:
U.S. equities experienced a turbulent week as investors reassessed AI valuations, technology spending and regulatory uncertainty. The S&P 500 declined approximately 2.7%, the Nasdaq Composite fell 3.4%, while the Dow Jones lost around 0.9%. Heavy selling in semiconductor and technology shares contributed to market losses, although Friday’s rebound offered some relief.
Indices:
Major U.S. indices recorded sharp price swings throughout the week. The S&P 500 closed around 7,376.86, the Nasdaq Composite finished near 24,579.42, and the Dow Jones ended at approximately 51,285.73. Technology-sector weakness, stronger U.S. employment data, interest-rate expectations and political developments remained key market drivers.
Important Events This Week:
FOREX : GBPUSD
GBPUSD is likely to experience volatility from 9–13 November 2026, driven by key UK and US economic releases. On 10 November, US October CPI (forecast: 0.3% monthly vs. 0.6% previous) will influence dollar strength and Fed rate expectations; on 12 November, UK Q3 GDP (forecast: 0.7% vs. 0.5% previous) could support the pound if growth beats expectations. Additionally, speeches by BoE Governor Andrew Bailey on 9 November and Chief Economist Huw Pill on 10 November, alongside US PPI data on 13 November (forecast: 0.4% vs. 1.3% previous), could trigger further price movements. Strong US inflation data may weaken GBPUSD, while stronger UK growth could push the pair higher.
GBPUSD
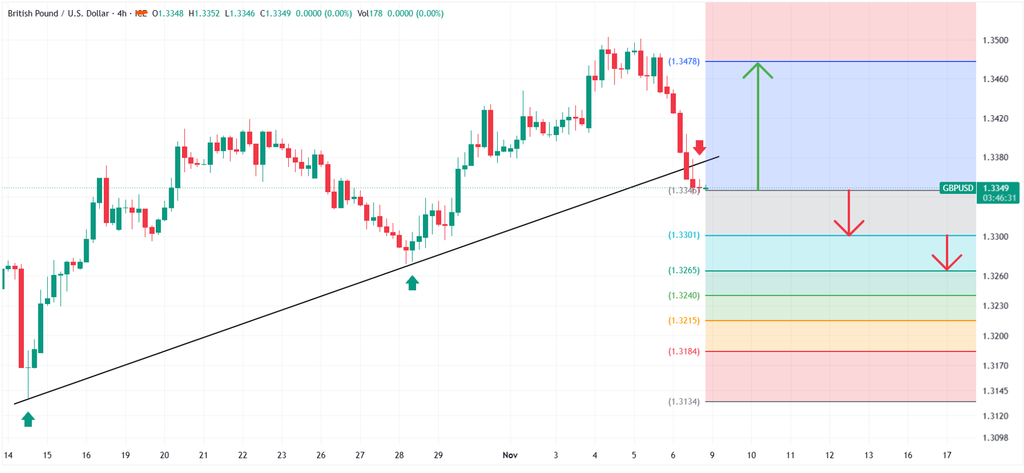
GBPUSD is trading around 1.3349, testing key support near 1.3347 after breaking below the rising trendline. A sustained break and hold above 1.3347 could support a BUY toward 1.3478, with further upside toward 1.3500, while SL sits around 1.3301 and RR is around 1:2.8. A rejection from the 1.3380–1.3400 resistance/trendline zone could trigger a SELL toward 1.3301, 1.3265 and 1.3215, with SL around 1.3478. A confirmed breakout above 1.3478 would strengthen the bullish outlook, while a sustained break below 1.3301 could increase selling pressure toward 1.3265, 1.3215 and 1.3184.
Always apply risk management.
METALS : XAUUSD ( GOLD )
XAUUSD is likely to experience volatility from 9–13 November 2026, driven mainly by U.S. inflation data and Federal Reserve policy expectations. On 10 November, U.S. October CPI (forecast: 0.3% vs. 0.6% previous) will be a major catalyst, while 13 November, U.S. PPI (forecast: 0.4% vs. 1.3% previous) could influence market direction. Fed officials’ speeches on 9, 10, 12 and 13 November, Treasury bond auctions and the 11 November U.S. bond-market holiday may also affect the dollar, yields and gold liquidity. Softer inflation and falling yields could push gold towards 4,148–4,200, while hotter inflation and rising yields could pressure prices towards $4,000 and $3,950.
XAUUSD ( GOLD )
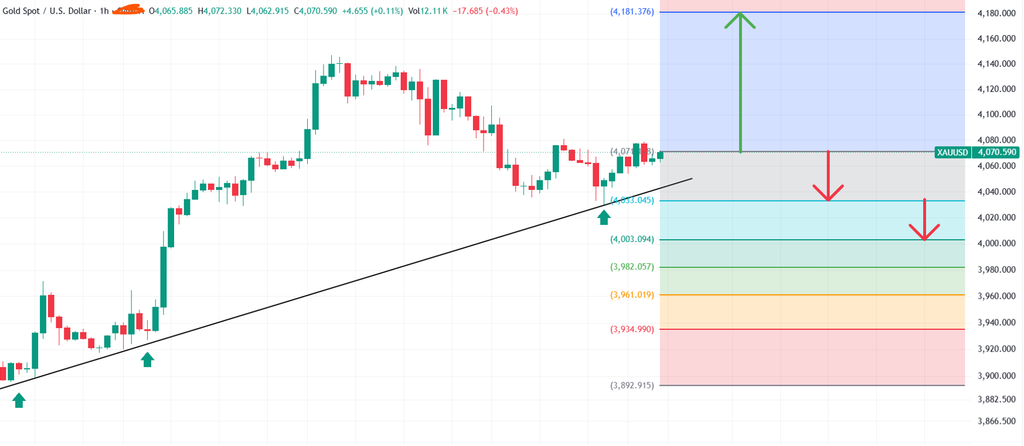
Gold (XAU/USD) is trading around 4,070.590, testing key resistance near 4,070.590 while holding above rising trendline support around 4,033.045. A sustained break above 4,070.590 could support a BUY toward 4,181.376, with SL at 4,033.045 and RR around 1:3.0. A rejection around 4,070.590 could trigger a SELL toward 4,033.045, 4,003.094 and 3,982.057, with SL at 4,181.376. A confirmed breakout above 4,181.376 would strengthen the bullish outlook, while a break below 4,033.045 could increase selling pressure toward 4,003.094, 3,982.057 and 3,961.019.
Always apply risk management.
ENERGY : USOIL
USOIL is likely to experience volatility from 9–13 November 2026, driven by U.S. inventory data, OPEC supply outlook and geopolitical developments. On 10 November, the EIA Short-Term Energy Outlook will provide updated global supply and demand forecasts, while the 11 November OPEC Monthly Oil Market Report could influence expectations around production and consumption. The 12 November EIA crude inventory report will be another major catalyst, with the previous report showing a 0.9 million-barrel draw to 409.8 million barrels. Continued U.S.–Iran peace negotiations and developments around the Strait of Hormuz could also affect supply risks. Rising inventories, recovering production and weaker demand may push oil lower, while larger inventory draws or renewed supply disruptions could support a rebound.
USOIL
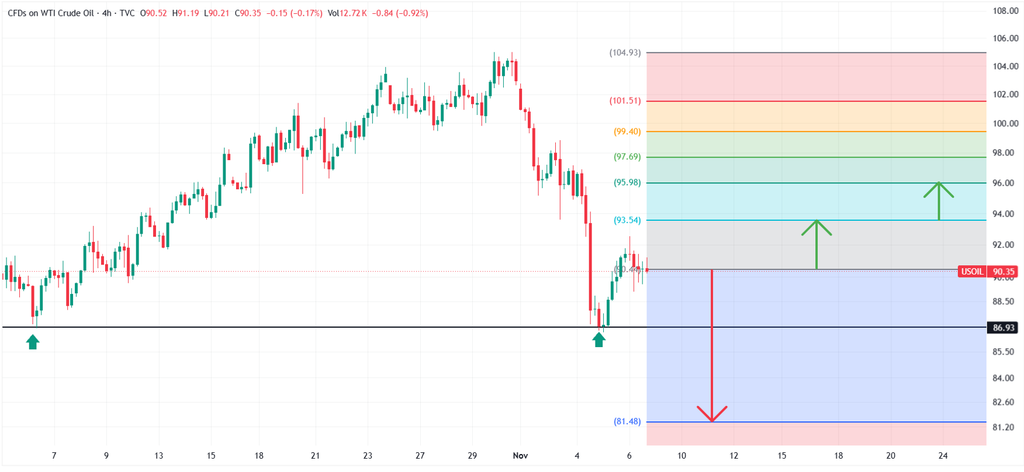
USOIL is trading around 90.35, testing key resistance near 90.42 after rebounding from the 86.93 support. A sustained break above 90.42 could support a BUY toward 93.54 and 95.98, with further targets at 97.69 and 99.40, while SL sits around 86.93 and RR is around 1:2.8. A rejection around 90.42 could trigger a SELL toward 86.93 and 81.48, with SL at 93.54 and RR around 1:2.8. A confirmed breakout above 93.54 would strengthen the bullish outlook, while a break below 86.93 could increase selling pressure toward 81.48.
Always apply risk management.
CRYPTO : BTCUSD ( BITCOIN )
BTCUSD and the broader cryptocurrency market are likely to experience volatility from 9–13 November 2026, driven by U.S. inflation data, institutional flows and regulatory uncertainty. On 10 November, U.S. October CPI will influence Federal Reserve rate expectations, while 13 November, October PPI could trigger further movements in the dollar and risk assets. U.S. spot Bitcoin ETFs recorded approximately $1.28 billion in net outflows between 2–6 November, creating selling pressure. Bitcoin also dropped towards $73,708 on 8 November amid concerns over stricter crypto regulations following the U.S. midterm elections and a reported $6 billion Binance security breach. Additionally, Fed speeches, the 11 November Veterans Day bond-market closure, and the 13 November $2.5 billion Bitcoin options expiry could influence liquidity and volatility. Continued ETF outflows and regulatory fears may push BTC lower, while softer inflation and renewed institutional buying could support a recovery.
BTCUSD
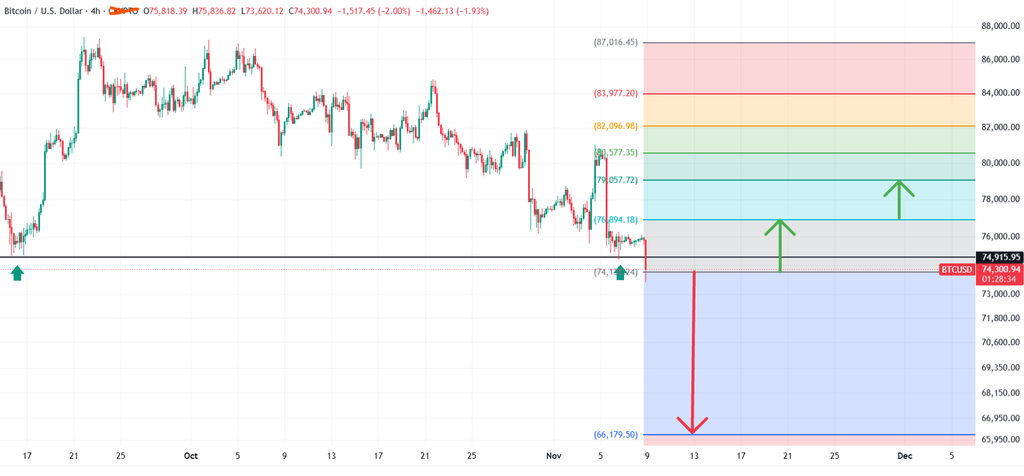
Bitcoin (BTC/USD) is trading around 74,300.94 on the 4-hour chart, testing key support near 74,128.24 following a strong bearish breakdown. Resistance stands at 74,915.95. A sustained break above 74,915.95 could support a BUY toward 76,894.18 and 79,057.72, with further targets at 80,577.35 and 82,096.98, while a confirmed break below 74,128.24 could trigger a SELL toward 66,179.50, with SL at 74,915.95 and an RR of approximately 1:10. A breakout above 76,894.18 would strengthen the bullish outlook, while a breakdown below 74,128.24 could increase selling pressure toward 66,179.50.
Always apply risk management.
STOCKS : NVIDIA
NVIDIA (NVDA) is likely to experience volatility from 9–13 November 2026, driven by AI demand, semiconductor-sector sentiment and U.S. inflation data. On 10 November, U.S. CPI figures could influence interest-rate expectations and technology-stock valuations, while 12 November, Cisco and Applied Materials earnings may provide fresh insight into AI infrastructure demand and semiconductor spending. Investors will also monitor CoreWeave’s 10 November earnings for signals about data-centre investment and demand for AI computing. NVIDIA’s upcoming 17 November Q3 earnings, with analysts expecting approximately $2.49 EPS, could encourage pre-earnings positioning. Strong AI demand, positive earnings guidance and continued GPU orders may support NVDA, while profit-taking, valuation concerns and weaker technology-sector sentiment could increase selling pressure.
NVIDIA
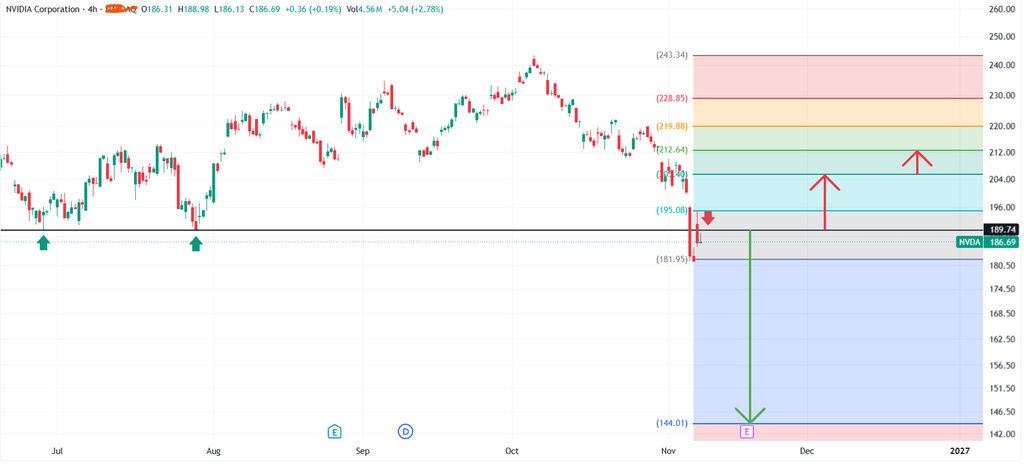
NVDA is trading around 186.69, testing key support near 181.95, with immediate resistance at 189.74. A sustained break above 189.74 could support a BUY toward 195.08 and 204.40, with further targets at 212.64 and 219.88. A rejection from 189.74 followed by a confirmed break below 181.95 could trigger a SELL toward 144.01, with SL at 195.08 and RR around 1:5.1. A confirmed breakout above 204.40 would strengthen the bullish outlook toward 212.64, while a breakdown below 181.95 could accelerate selling pressure toward 144.01.
Always apply risk management.
#ForexMarket #MarketRecap #TradingAnalysis #GoldTrading #OilTrading #BitcoinTrading #StockMarket #Nasdaq #RiskManagement #FinancialMarkets #TenTrade