Trading With Indicators: Turning Market Noise Into Smarter Decisions

Imagine driving through heavy rain with a dirty windshield. You can still move forward but seeing the road clearly becomes difficult. Trading indicators work like tools that help clean the windshield, they don’t tell you exactly what will happen, but they can help you understand what is happening in the market.
Indicators can make trading more structured, especially when combined with price action, support and resistance and proper risk management.
What Are Trading Indicators?
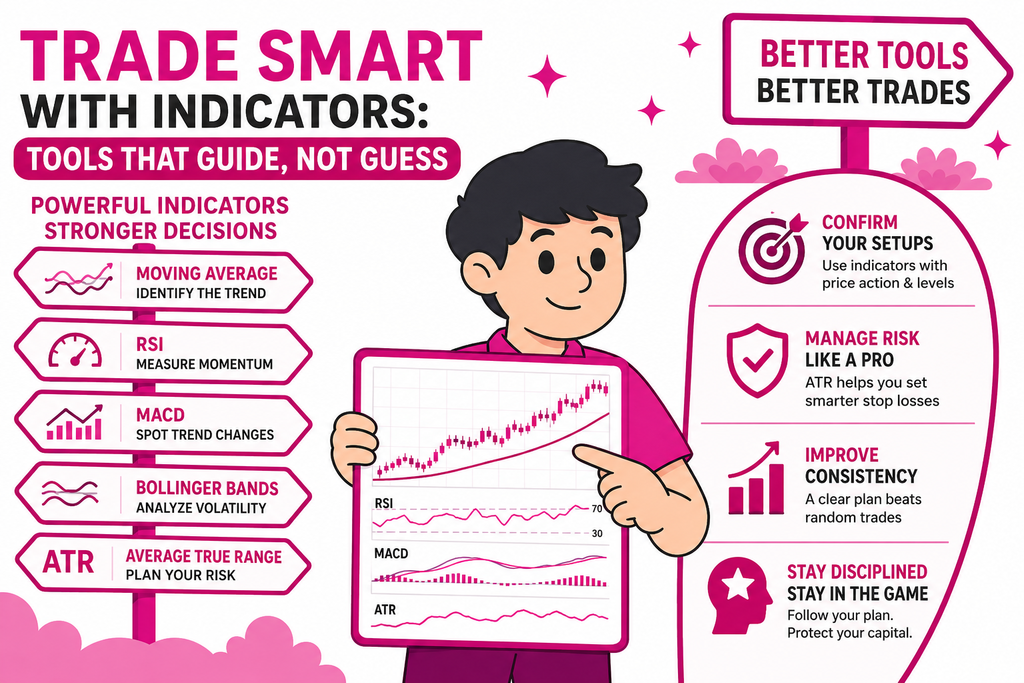
Trading indicators are mathematical tools that analyse price, volume, momentum, or volatility to help traders identify potential opportunities.
Some popular indicators include:
- Moving Average (MA): Helps identify the market trend.
- Relative Strength Index (RSI): Measures momentum and potential overbought or oversold conditions.
- MACD: Helps identify momentum and possible trend changes.
- Bollinger Bands: Helps analyse volatility and potential price extremes.
- Average True Range (ATR): Helps traders understand market volatility and plan stop-loss distances.
Think of them like the dashboard of a car. Your speedometer, fuel gauge and temperature gauge each provide different information. You wouldn’t drive using only the fuel gauge and you shouldn’t trade based on only one indicator.
Example: Using a Moving Average
Suppose you’re analysing XAUUSD (Gold) and price is trading above the 50-period moving average. The moving average is also rising.
This suggests that buyers may currently have control.
Now imagine price pulls back toward the moving average, finds support and forms a bullish candle.
Instead of buying simply because price is above the moving average, you could wait for this additional confirmation before considering a trade.
Example:
Gold price → above rising 50 MA → pulls back → finds support → bullish rejection → potential buy setup.
The indicator doesn’t make the decision for you. It simply helps you organise the evidence.
Example: RSI and Momentum
Imagine Gold has been climbing rapidly for several hours and RSI moves above 70.
Does that automatically mean SELL NOW?
Not necessarily.
An RSI above 70 can show strong momentum, not an immediate reversal. In a strong bullish trend, price can remain overbought for a long time.
A smarter approach is to wait for additional evidence, such as resistance, bearish price action or a break of market structure.
Think of RSI as a warning light, not a traffic officer.
It tells you to pay attention; it doesn’t necessarily tell you to stop.
Combining Indicators
One of the biggest mistakes beginners make is putting ten indicators on one chart until the candles almost disappear.
More indicators do not automatically mean better analysis.
Instead, give each tool a specific job.
For example:
Moving Average → Identify trend
RSI → Check momentum
ATR → Understand volatility
Price Action → Confirm the entry
Support/Resistance → Identify important levels
Now your chart has a purpose rather than becoming a collection of colourful lines.
A Simple Trading Example
Suppose GBPUSD is in an uptrend.
You identify:
- Price is above the 50 MA.
- The 50 MA is rising.
- Price pulls back toward a previous support zone.
- RSI remains above 50, showing bullish momentum.
- A bullish candle forms from support.
Instead of entering immediately, you could wait for the bullish candle to close and then consider an entry.
Your plan might look like:
Entry: Above the confirmation candle
Stop Loss: Below the support zone
Take Profit: Near the next resistance
Risk: A small, predefined percentage of your account
This is much more structured than simply saying, “The indicator says BUY.”
Indicators Are Not Crystal Balls
This is perhaps the most important lesson.
Indicators are based largely on historical price data. They can help identify trends, momentum and volatility, but they cannot guarantee the next candle.
A buy signal can fail.
A sell signal can fail.
Even several indicators can agree and price can still move in the opposite direction.
That is why professional trading is not about finding a magical indicator. It is about building a repeatable process.
The Winning Combination
A strong trading approach can be thought of as:
Indicator + Price Action + Market Structure + Risk Management + Discipline
For example, an indicator may tell you that momentum is bullish. Market structure may confirm an uptrend, while price action provides the entry trigger. Risk management then determines how much you can afford to lose if the idea fails.
That final part matters enormously.
A great trade with poor risk management can still damage your account.
Final Thought
Trading indicators should not replace your judgement, they should improve it.
Use them to answer questions such as:
What is the trend?
Is momentum supporting the move?
How volatile is the market?
Where could price react?
Where does my trade idea become invalid?
The goal isn’t to predict every market move.
The goal is to build a clear trading plan, wait for quality setups, manage your risk and execute with discipline.
Because in trading, the trader with the most indicators doesn’t necessarily win.
The trader who knows how to use the right tools at the right time has the better chance of staying in the game.