Midweek Market Outlook – 21 / October / 2026

The midweek market outlook focuses on key price levels across gold, EUR/USD, Bitcoin, crude oil, and NVIDIA. With markets testing critical support and resistance zones, watch for confirmed breakouts or breakdowns to identify potential trading opportunities. Stay alert, follow the market trends, and always apply proper risk management before entering any trade.
METALS : GOLD
Market Context:
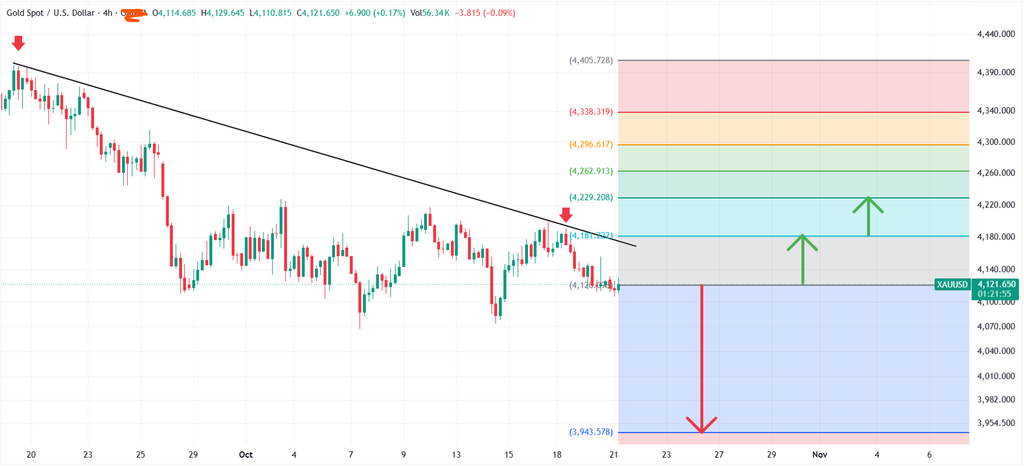
Gold (XAU/USD) is trading around 4,121.650, testing support near 4,120 within a broader downtrend. Resistance lies at 4,181, followed by 4,229. A confirmed breakout or breakdown could determine the next major move.
Bearish Scenario:
A sustained break below 4,120 could expose downside targets at 4,070, 4,010 and potentially 3,944.
Bullish Scenario:
If gold reclaims 4,181 and breaks above 4,229, upside could extend toward 4,263 and 4,297.
Set Up:
🔴 SELL: Below 4,120 after confirmation/retest SL: 4,181 TP: 3,944 RR: 1:2.9
🟢 BUY: Above 4,181 after confirmed breakout/retest SL: 4,120 TP: 4,229 RR: 1:0.8
Apply Risk Management Always.
FOREX : EURUSD
Market Context:
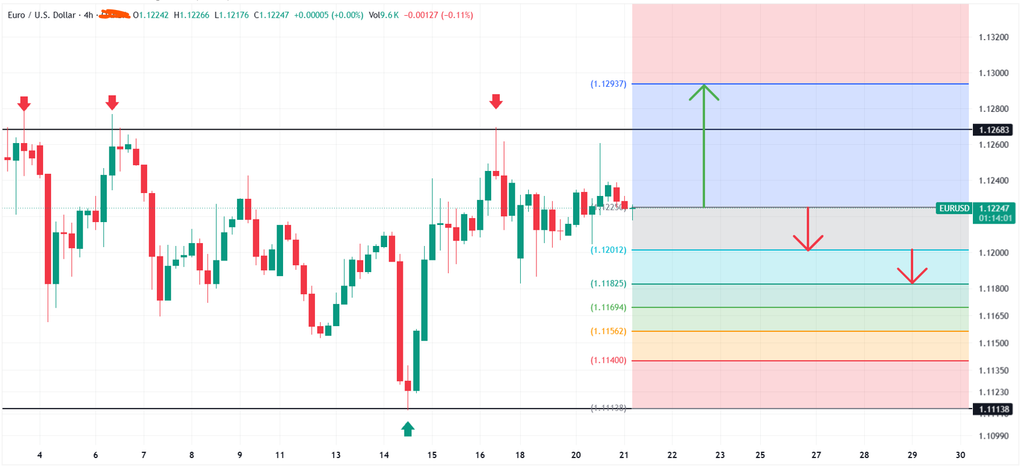
EUR/USD is trading around 1.12247, facing resistance at 1.12683. Key support sits at 1.12012, with further downside levels at 1.11825 and 1.11694. A confirmed breakout or breakdown could determine the next major move.
Bearish Scenario:
A sustained break and retest below 1.12012 could open downside toward 1.11825, 1.11694 and potentially 1.11400.
Bullish Scenario:
If EUR/USD breaks and holds above 1.12683, upside could extend toward 1.12937.
Set Up:
🔴 SELL: Below 1.12012 after confirmation/retest SL: 1.12247 TP: 1.11400 RR: 1:2.6
🟢 BUY: Above 1.12683 after confirmed breakout/retest SL: 1.12247 TP: 1.12937 RR: 1:0.6
Apply Risk Management Always.
CRYPTO : BTCUSD
Market Context:
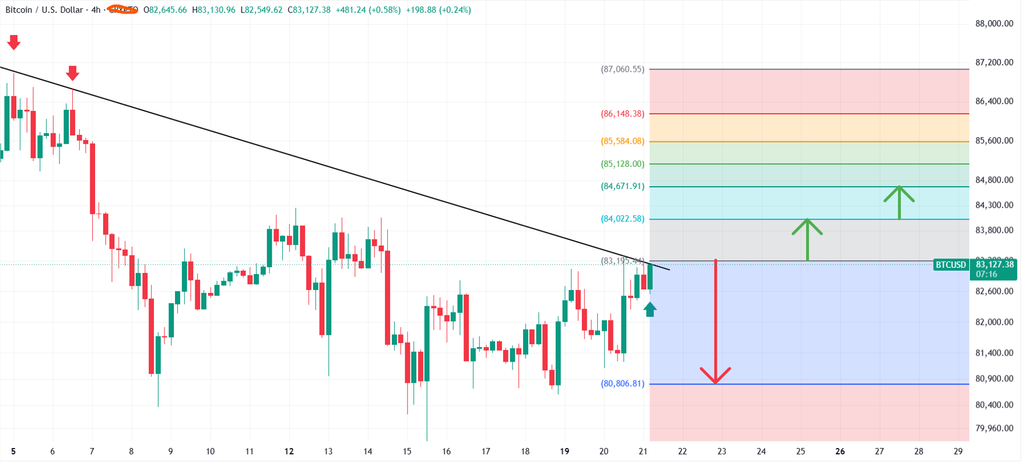
Bitcoin (BTC/USD) is testing the 83,195 resistance/trendline after recovering from recent lows. A confirmed breakout above this level could open the way toward 84,022, while rejection could send price back toward 80,807 support.
Bearish Scenario:
A rejection at 83,195 followed by a confirmed break below 80,807 could expose Bitcoin to further downside. However, a rejection alone may first lead to a retest of the support zone.
Bullish Scenario:
If Bitcoin breaks and holds above 83,195, upside targets are 84,022, 84,672, 85,128 and potentially 85,584.
Set Up:
🔴 SELL: Below 80,807 after confirmed breakdown/retest SL: 83,195 TP: 76,031 RR: Approximately 1:2.0
🟢 BUY: Above 83,195 after confirmed breakout/retest SL: 80,807 TP: 85,128 RR: Approximately 1:0.8
Apply Risk Management Always
ENERGY : USOIL
Market Context:
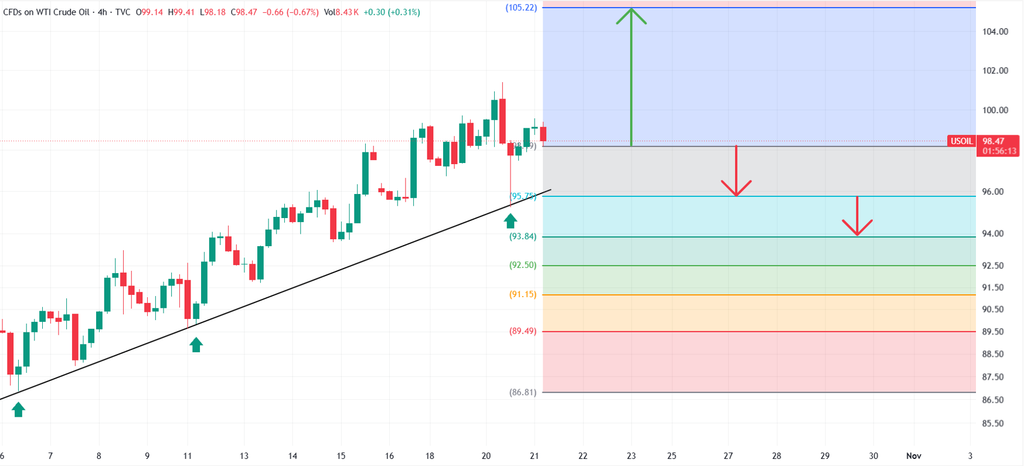
WTI Crude Oil is trading around 98.47, holding above the rising trendline, with key support at 95.75 and resistance/ upside target at 105.22. A confirmed break of either level could determine the next major move.
Bearish Scenario:
A sustained break below 95.75 could expose downside toward 93.84, 92.50, 91.15 and potentially 89.49.
Bullish Scenario:
If WTI holds above 95.75 and resumes its upward momentum, price could advance toward 100.00 and potentially 105.22. A confirmed breakout above the recent highs would strengthen the bullish outlook.
Set Up:
🔴 SELL: Below 95.75 after confirmed breakdown/retest SL: 98.47 TP: 89.49 RR: 1:2.3
🟢 BUY: Above 98.47 after confirmed breakout/retest SL: 95.75 TP: 105.22 RR: 1:2.5
Apply Risk Management Always
STOCKS : NVIDIA
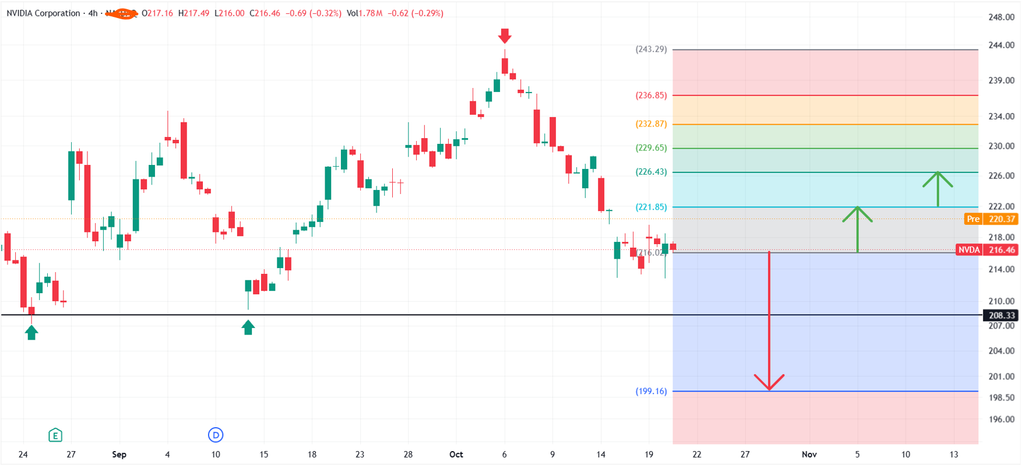
Market Context:
NVIDIA (NVDA) is trading around 216.46, testing key support at 216.02, with resistance at 221.85. A confirmed break of either level could determine the next major move.
Bearish Scenario:
A sustained break below 216.02 could open downside toward 208.33 and potentially 199.16.
Bullish Scenario:
A confirmed break and hold above 221.85 could push price toward 226.43, 229.65, and potentially 232.87.
Set Up:
🔴 SELL: Below 216.02 after confirmation/retest SL: 221.85 TP: 199.16 RR: 1:2.9
🟢 BUY: Above 221.85 after confirmed breakout/retest SL: 216.02 TP: 229.65 RR: 1:1.3
Apply Risk Management Always.