Midweek Market Outlook – 18th / November / 2026

Markets are facing critical turning points across major asset classes, with Gold trading at 3,804.320, EUR/USD at 1.09946, Bitcoin at 64,512.88, USOIL at 83.91, and NVIDIA at 155.65. All five assets are testing key support levels amid broader bearish trends. This week, watch for potential breakdowns or bullish recoveries as key resistance levels come into focus. Stay alert for opportunities, trade with confirmation, and manage your risk wisely!
METALS : GOLD
Market Context:
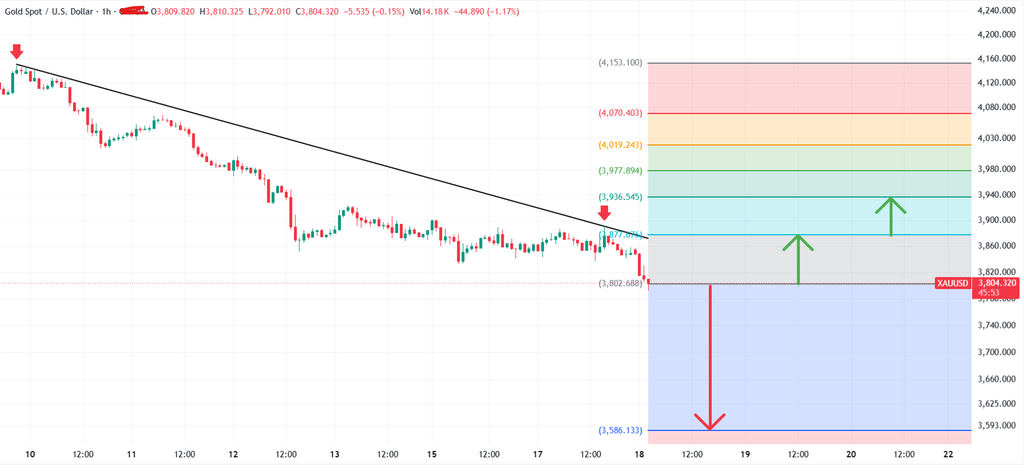
Gold (XAU/USD) is trading around 3,804.320 on the 1-hour timeframe, following a sustained bearish move within a descending trendline. Price is currently testing a critical support region around 3,802.688. A confirmed break below this level could extend selling pressure towards 3,586.133. However, if buyers defend this support and price recovers above the immediate resistance at 3,877.676, a bullish correction could develop towards 3,936.545, 3,977.894 and potentially 4,019.243. The next directional move will likely depend on how price reacts around the 3,802.688 support level.
Bearish Scenario:
A confirmed breakdown below 3,802.688, followed by a successful retest, could strengthen bearish momentum towards 3,586.133.
Bullish Scenario:
A confirmed breakout above 3,877.676 could signal a short-term recovery, opening the way towards 3,936.545, followed by 3,977.894.
Set Up:
🔴 SELL: Below 3,802.688 after confirmation/retest
SL: 3,877.676
TP: 3,586.133
RR: Approximately 1:2.9
🟢 BUY: Above 3,877.676 after confirmed breakout/retest
SL: 3,802.688
TP: 3,977.894
RR: Approximately 1:1.3
Apply Risk Management Always.
FOREX : EURUSD
Market Context:
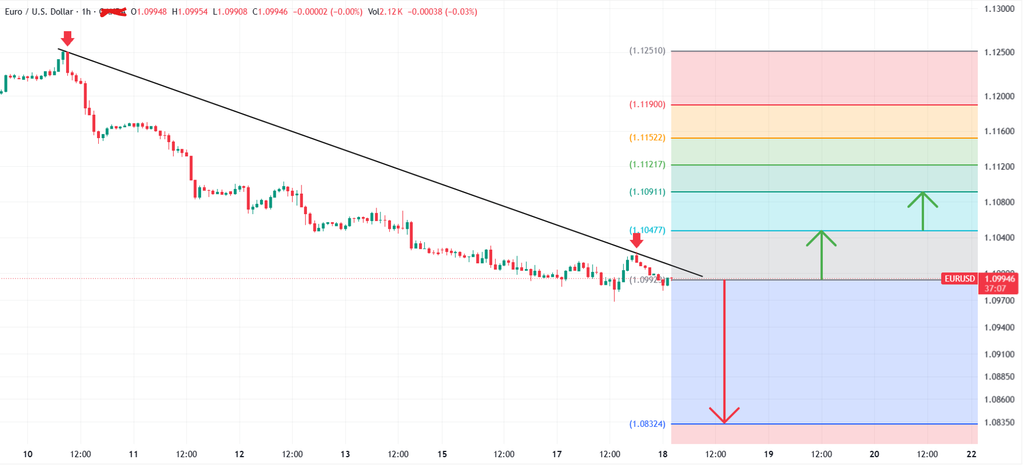
EUR/USD is trading around 1.09946 on the 1-hour timeframe, testing key support near 1.09923 within a broader downtrend. Immediate resistance sits at 1.10477, followed by 1.10911 and 1.11217. A confirmed break above resistance could signal a short-term bullish recovery, while a break below support could resume the bearish trend.
Bearish Scenario:
A confirmed break below 1.09923 could expose downside toward 1.08324, with the broader downtrend remaining intact.
Bullish Scenario:
A sustained breakout above 1.10477 could strengthen buying momentum toward 1.10911, followed by 1.11217.
Set Up:
🔴 SELL: Below 1.09923 after confirmation/retest
SL: 1.10477
TP: 1.08324
RR: Approximately 1:2.9
🟢 BUY: Above 1.10477 after confirmed breakout/retest
SL: 1.09923
TP: 1.10911
RR: Approximately 1:0.8
Apply Risk Management Always.
CRYPTO : BTCUSD
Market Context:
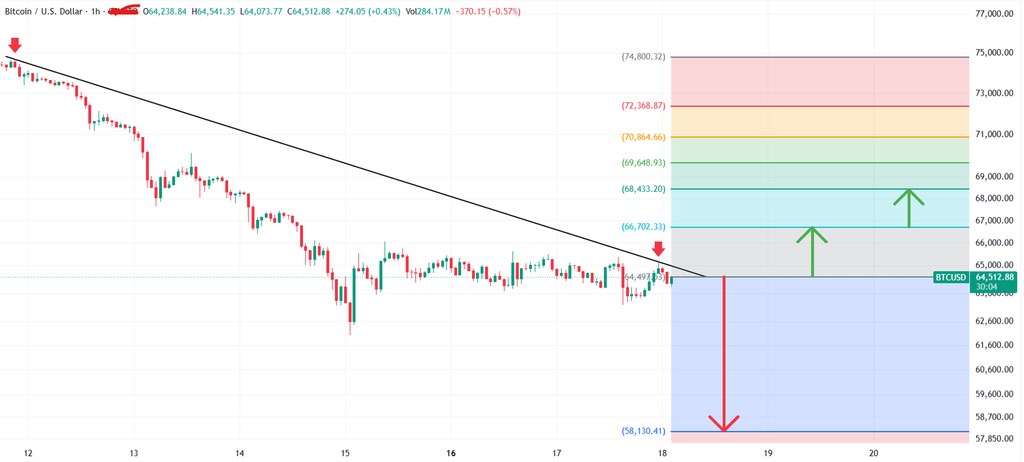
Bitcoin (BTC/USD) is trading around 64,512.88 on the 1-hour timeframe, consolidating near key support around 64,497.33 within a broader downtrend. Immediate resistance sits at 66,702.33, followed by 68,433.20. A confirmed breakout above resistance could support a short-term recovery, while a break below support could resume the bearish move toward 58,130.41.
Bearish Scenario:
A confirmed break below 64,497.33 could weaken the current consolidation and expose downside toward 58,130.41.
Bullish Scenario:
A sustained breakout above 66,702.33 could strengthen buying momentum toward 68,433.20, with further upside possible toward 69,648.93.
Set Up:
🔴 SELL: Below 64,497.33 after confirmation/retest
SL: 66,702.33
TP: 58,130.41
RR: Approximately 1:2.9
🟢 BUY: Above 66,702.33 after confirmed breakout/retest
SL: 64,497.33
TP: 68,433.20
RR: Approximately 1:0.8
Apply Risk Management Always.
ENERGY : USOIL
Market Context:
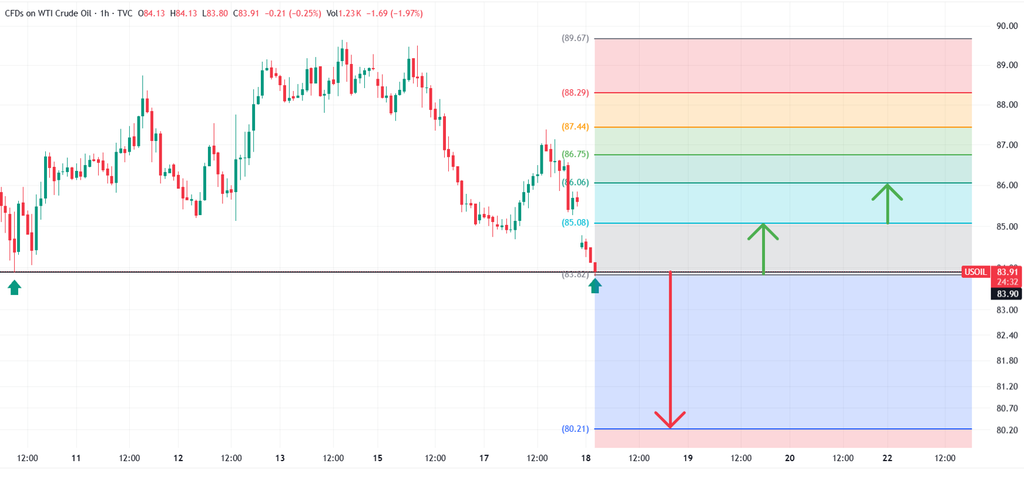
WTI Crude Oil is trading around 83.91 on the 1-hour timeframe, testing key support near 83.82 after a sharp bearish move. Immediate resistance sits at 85.08, followed by 86.06 and 86.75. A confirmed break above resistance could support a short-term recovery, while a break below 83.82 could expose further downside toward 80.21.
Bearish Scenario:
A confirmed break below 83.82 could resume bearish momentum and expose downside toward 80.21.
Bullish Scenario:
A sustained breakout above 85.08 could strengthen buying momentum toward 86.06, followed by 86.75.
Set Up:
🔴 SELL: Below 83.82 after confirmation/retest
SL: 85.08
TP: 80.21
RR: Approximately 1:2.9
🟢 BUY: Above 85.08 after confirmed breakout/retest
SL: 83.82
TP: 86.06
RR: Approximately 1:0.8
Apply Risk Management Always.
STOCKS : NVIDIA
Market Context:
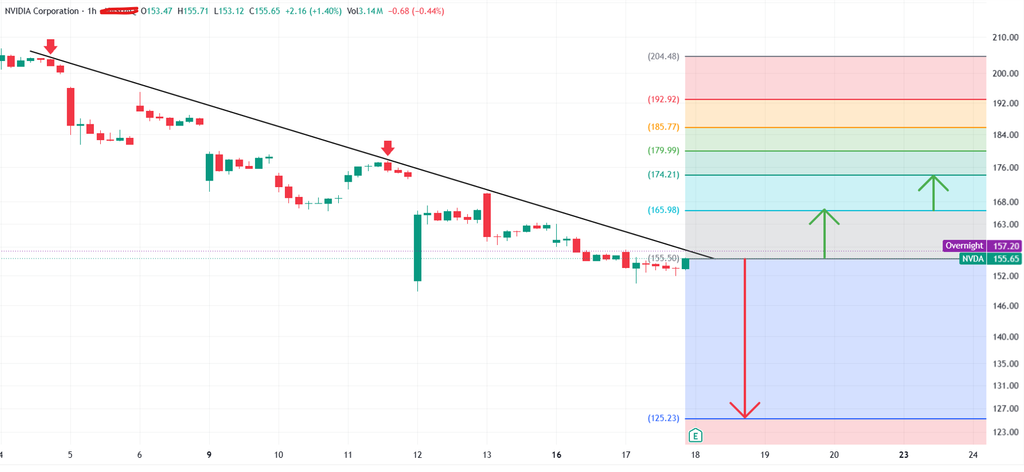
NVIDIA is trading around 155.65 on the 1-hour timeframe, testing key support near 155.50 after a prolonged downtrend. Immediate resistance sits at 165.98, followed by 174.21. A sustained break above resistance could signal a bullish reversal, while a break below 155.50 could expose deeper downside toward 125.23.
Bearish Scenario:
A confirmed break below 155.50 could resume bearish momentum and expose downside toward 125.23.
Bullish Scenario:
A sustained breakout above 165.98 could strengthen buying momentum toward 174.21, with further upside possible toward 179.99.
Set Up:
🔴 SELL: Below 155.50 after confirmation/retest
SL: 165.98
TP: 125.23
RR: Approximately 1:2.9
🟢 BUY: Above 165.98 after confirmed breakout/retest
SL: 155.50
TP: 174.21
RR: Approximately 1:0.8
Apply Risk Management Always.
#MidweekMarketOutlook #ForexTrading #GoldTrading #EURUSD #BitcoinTrading #CrudeOil #NVIDIA #MarketAnalysis #TradingSignals #FundamentalAnalysis #TenTrade