Midweek Market Outlook – 11th / November / 2026

Markets enter the second half of the week with key price levels shaping opportunities across major assets. Gold trades at $4,043.69, Bitcoin at $73,695.83, WTI oil at $86.67, EUR/USD at 1.11626, while NVIDIA stands at $168.79. Investors will monitor upcoming US economic data, central bank commentary, inflation figures and geopolitical developments for fresh volatility. Watch key support and resistance levels as breakout or breakdown moves could define market direction for the remainder of the week.
METALS : GOLD
Market Context:
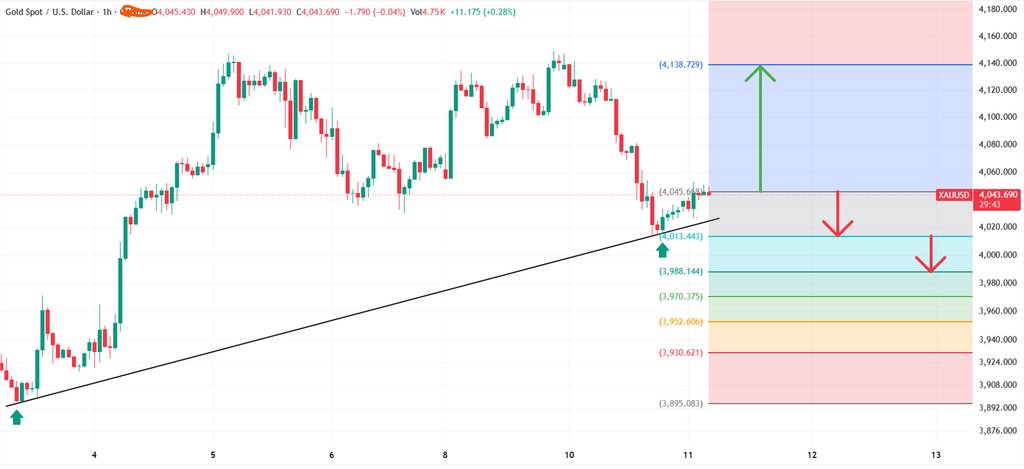
Gold (XAU/USD) is trading around 4,043.690 on the 1-hour timeframe, following a recovery from the 4,013.443 support region, which aligns with the rising trendline. Price is currently testing immediate resistance around 4,045.668. A sustained break above this level could strengthen bullish momentum towards 4,080 and 4,138.729. However, failure to maintain the recovery, followed by a break below 4,013.443, could expose lower support levels at 3,988.144, 3,970.375 and 3,952.606. The next directional move will likely depend on how price reacts around these key levels.
Bearish Scenario:
A confirmed break below 4,013.443 could weaken the current recovery and expose downside targets at 3,988.144, 3,970.375 and potentially 3,952.606.
Bullish Scenario:
A confirmed breakout above 4,045.668 could strengthen buying momentum towards 4,080, followed by 4,138.729.
Set Up:
🔴 SELL: Below 4,013.443 after confirmation/retest
SL: 4,045.668
TP: 3,952.606
RR: Approximately 1:1.9
🟢 BUY: Above 4,045.668 after confirmed breakout/retest
SL: 4,013.443
TP: 4,138.729
RR: Approximately 1:2.9
Apply Risk Management Always.
FOREX : EURUSD
Market Context:
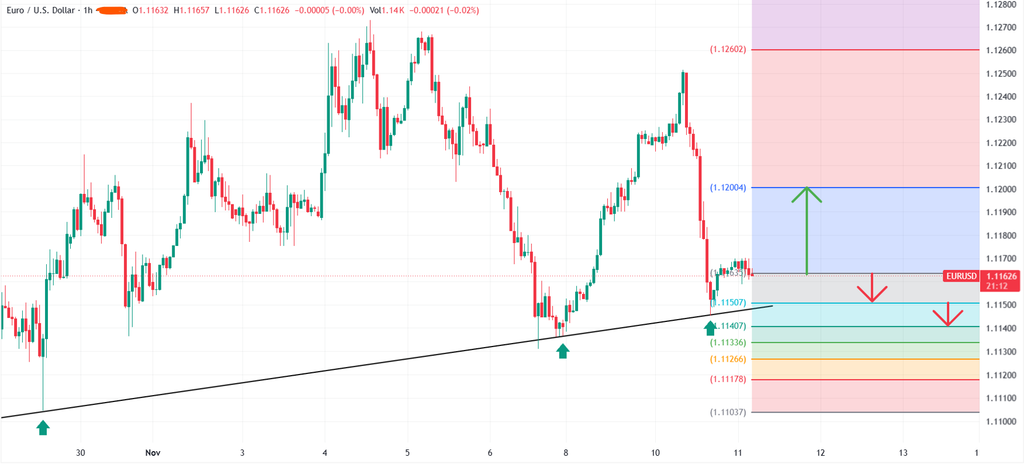
EUR/USD is trading around 1.11626 on the 1-hour chart, following a sharp bearish rejection from the 1.12500 resistance region. Price is currently consolidating near 1.11635, with immediate support at 1.11507, aligned with the rising trendline. Key resistance stands at 1.12004, followed by 1.12602. A confirmed breakout or breakdown could determine the next major move.
Bearish Scenario:
A sustained break below 1.11507 and the rising trendline could increase selling pressure, exposing downside targets at 1.11407, 1.11336, 1.11266 and potentially 1.11178.
Bullish Scenario:
A successful hold above 1.11507 could trigger a recovery towards 1.12004. A confirmed breakout above this resistance could strengthen bullish momentum towards 1.12602.
Set Up:
🔴 SELL: Below 1.11507 after confirmation/retest
SL: 1.12004
TP: 1.11037
RR: Approximately 1:0.9
🟢 BUY: Above 1.12004 after confirmed breakout/retest
SL: 1.11507
TP: 1.12602
RR: Approximately 1:1.2
Apply Risk Management Always.
CRYPTO : BTCUSD
Market Context:
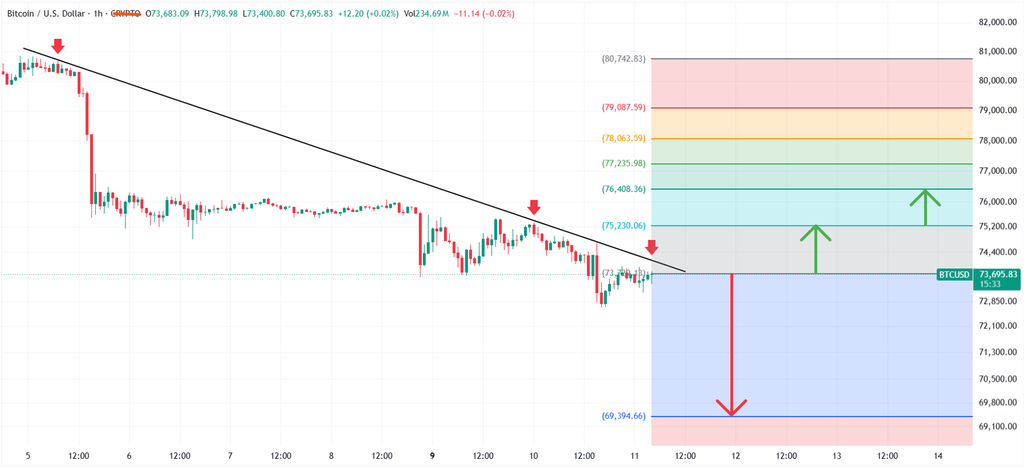
Bitcoin (BTC/USD) is trading around 73,695.83 on the 1-hour chart, consolidating below a descending trendline that continues to act as dynamic resistance. The overall short-term structure remains bearish, with sellers maintaining pressure. Immediate resistance stands at 75,230.06, followed by 76,408.36, 77,235.98 and 78,063.59. Key support is around 73,695.83, with a potential downside target at 69,394.66. A confirmed breakout or breakdown could determine the next major move.
Bearish Scenario:
A sustained break below 73,695.83 could strengthen bearish momentum, exposing downside towards 72,850, 71,300 and potentially 69,394.66.
Bullish Scenario:
A confirmed break above the descending trendline and 75,230.06 could signal a potential bullish reversal, opening the way towards 76,408.36, 77,235.98 and 78,063.59.
Set Up:
🔴 SELL: Below 73,695.83 after confirmation/retest
SL: 75,230.06
TP: 69,394.66
RR: Approximately 1:2.8
🟢 BUY: Above 75,230.06 after confirmed breakout/retest
SL: 73,695.83
TP: 78,063.59
RR: Approximately 1:1.8
Apply Risk Management Always.
ENERGY : USOIL
Market Context:
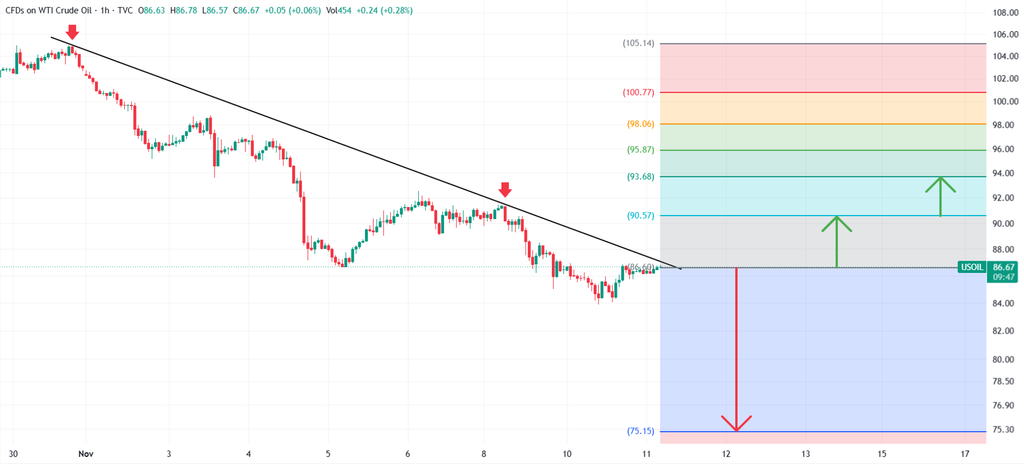
WTI Crude Oil (USOIL) is trading around 86.67, following a prolonged bearish move from the 105.14 region. Price remains below a descending trendline, indicating that the broader short-term structure is still bearish. However, recent price action suggests a potential recovery from the 84.00–85.00 support region. Immediate resistance lies at 90.57, followed by 93.68, 95.87, 98.06 and 100.77. Key support is around 86.60, with further downside potential towards 75.15. A confirmed breakout above the descending trendline or a rejection at resistance could determine the next major move.
Bearish Scenario:
A sustained break below 86.60, followed by confirmation and a successful retest, could strengthen selling pressure and expose downside targets towards 84.00, 80.00 and ultimately 75.15.
Bullish Scenario:
A confirmed breakout above the descending trendline and 90.57 resistance could signal a potential bullish reversal, opening the way towards 93.68, 95.87 and 98.06.
Set Up:
🔴 SELL: Below 86.60 after confirmation/retest
SL: 90.57
TP: 75.15
RR: Approximately 1:2.9
🟢 BUY: Above 90.57 after confirmed breakout/retest
SL: 86.60
TP: 98.06
RR: Approximately 1:1.9
Apply Risk Management Always.
STOCKS : NVIDIA
Market Context:
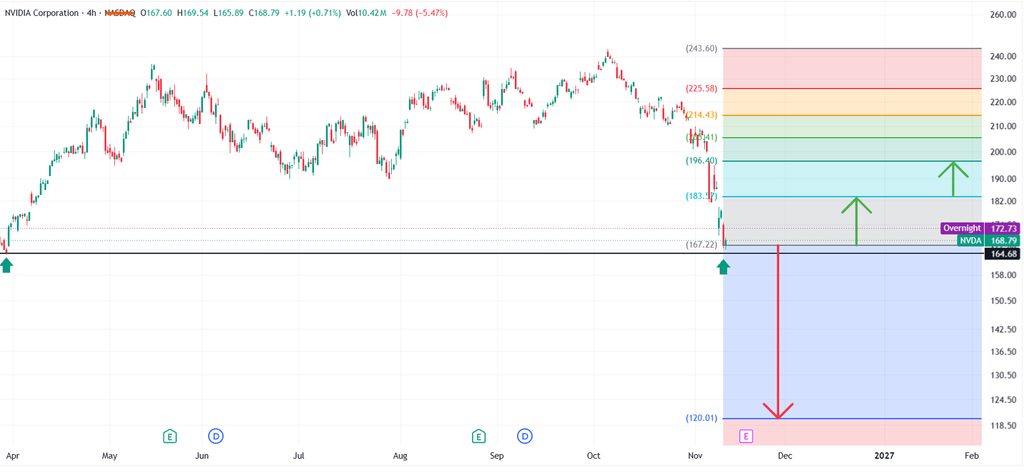
NVIDIA Corporation (NVDA) is trading around 168.79, following a sharp bearish sell-off from the 240.00 region. Price has experienced a significant decline and is currently testing a key support zone around 167.22–164.68. This area could determine whether buyers regain control or sellers extend the downward move. Immediate resistance lies at 183.57, followed by 196.40, 205.41, 214.43 and 225.58. Key support is at 164.68, with further downside potential towards 150.50 and ultimately 120.01. A confirmed breakout or breakdown could determine the next major move.
Bearish Scenario:
A sustained break below 164.68 could invalidate the potential bullish recovery and expose further downside targets at 150.50, 136.50 and potentially 120.01.
Bullish Scenario:
A confirmed recovery above 183.57 could strengthen buying momentum and signal a potential reversal, opening the way towards 196.40, 205.41, 214.43 and 225.58.
Set Up:
🔴 SELL: Below 164.68 after confirmation/retest
SL: 183.57
TP: 120.01
RR: Approximately 1:2.4
🟢 BUY: Above 183.57 after confirmed breakout/retest
SL: 164.68
TP: 214.43
RR: Approximately 1:1.6
Apply Risk Management Always.
Apply Risk Management Always.
#MidweekMarketOutlook #ForexTrading #GoldTrading #EURUSD #BitcoinTrading #CrudeOil #NVIDIA #MarketAnalysis #TradingSignals #FundamentalAnalysis #TenTrade