Midweek Market Outlook – 4th / November / 2026

Midweek markets remain volatile, with Gold trading at $4,007.925, EUR/USD at 1.12312, Bitcoin at $77,918.70, WTI Oil at $96.24 and NVIDIA at $206.57. This week’s outlook examines key technical levels alongside major market catalysts, including US economic data, Federal Reserve policy expectations, the US dollar, inflation, geopolitical developments, crude oil supply dynamics and technology-sector sentiment. These factors could drive volatility, influence market direction and create trading opportunities across five major asset classes.
Key events to watch include Eurozone inflation (CPI), US ADP employment data, ISM Services PMI, US crude oil inventory figures and Friday’s Non-Farm Payrolls (NFP). Investors should also monitor Federal Reserve rate expectations, US Treasury yields, geopolitical tensions and AI-sector developments, as these could influence the US dollar, gold, oil, cryptocurrencies and technology stocks.
METALS : GOLD
Market Context:
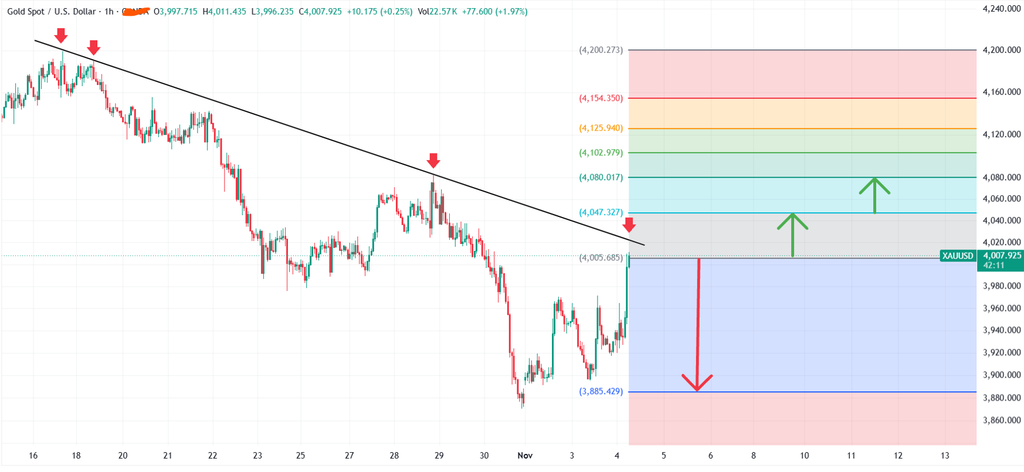
Gold (XAU/USD) is trading around 4,007.925, following a strong bullish recovery from the 3,885 support region. Price has broken above the descending trendline, suggesting a potential shift in short-term momentum. Immediate resistance lies at 4,047.327, followed by 4,080.017, 4,102.979 and 4,125.940. Key support is at 4,005.685, with further downside support around 3,885.429. A confirmed breakout or breakdown could determine the next major move.
Bearish Scenario:
A sustained break below 4,005.685 could invalidate the short-term bullish recovery and expose downside targets at 3,980, 3,940 and potentially 3,885.429.
Bullish Scenario:
A confirmed break above 4,047.327 could strengthen buying momentum towards 4,080.017, 4,102.979 and 4,125.940.
Set Up:
🔴 SELL: Below 4,005.685 after confirmation/retest
SL: 4,047.327
TP: 3,885.429
RR: Approximately 1:2.9
🟢 BUY: Above 4,047.327 after confirmed breakout/retest
SL: 4,005.685
TP: 4,125.940
RR: Approximately 1:1.9
Apply Risk Management Always.
FOREX : EURUSD
Market Context:
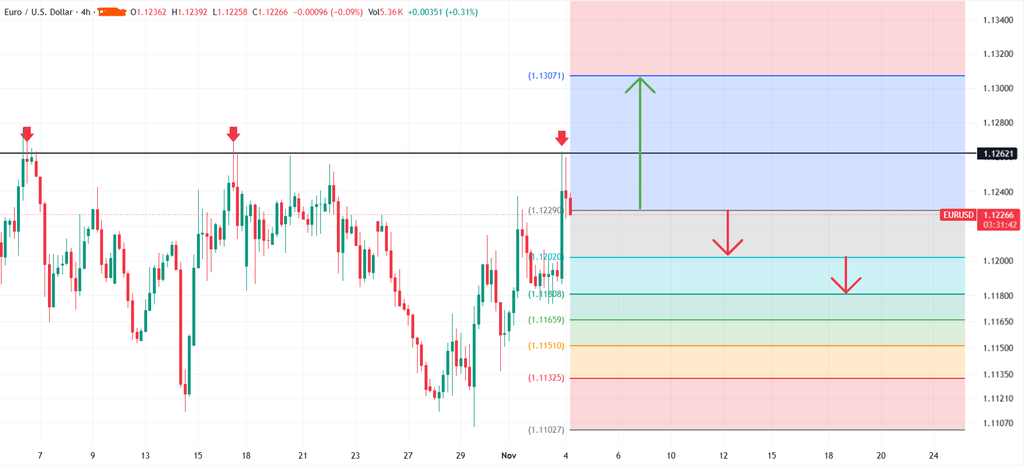
EUR/USD is trading around 1.12312, facing resistance near 1.12621 following a bullish recovery from the 1.11027 support region. Price has repeatedly encountered selling pressure around 1.12621, making this a key resistance zone. Immediate support lies at 1.12290, followed by 1.12020, 1.11808 and 1.11659. A confirmed breakout or breakdown could determine the next major move.
Bearish Scenario:
A sustained break below 1.12290 could increase selling pressure towards 1.12020, 1.11808 and potentially 1.11659.
Bullish Scenario:
A confirmed break above 1.12621 could strengthen buying momentum towards 1.13071, with further upside potential if buyers maintain control.
Set Up:
🔴 SELL: Below 1.12290 after confirmation/retest
SL: 1.12621
TP: 1.11808
RR: Approximately 1:1.5
🟢 BUY: Above 1.12621 after confirmed breakout/retest
SL: 1.12290
TP: 1.13071
RR: Approximately 1:1.4
Apply Risk Management Always.
CRYPTO : BTCUSD
Market Context:
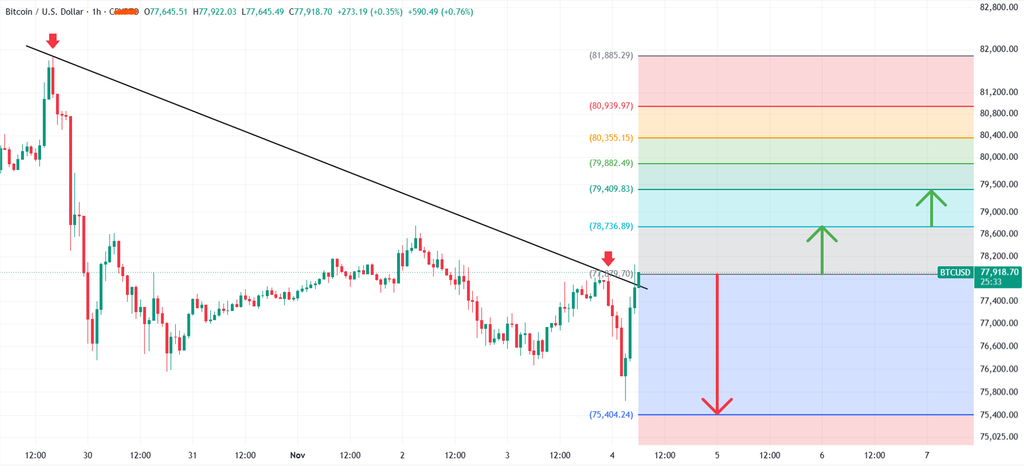
Bitcoin (BTC/USD) is trading around 77,918.70, testing a key descending trendline and resistance zone near 77,879.70. The broader trend remains bearish, although a breakout could signal a potential recovery. Key resistance lies at 78,736.89, followed by 79,409.83 and 79,882.49. Major support sits at 75,404.24. A confirmed breakout or breakdown could determine the next major move.
Bearish Scenario:
A sustained break below 77,879.70 could expose downside toward 76,600, 76,000 and potentially 75,404.24.
Bullish Scenario:
A confirmed break above 78,736.89 could support a recovery toward 79,409.83, 79,882.49 and potentially 80,355.15.
Set Up:
🔴 SELL: Below 77,879.70 after confirmation/retest
SL: 78,736.89
TP: 75,404.24
RR: Approximately 1:2.9
🟢 BUY: Above 78,736.89 after confirmed breakout/retest
SL: 77,879.70
TP: 79,409.83
RR: Approximately 1:0.8
Apply Risk Management Always.
ENERGY : USOIL
Market Context:
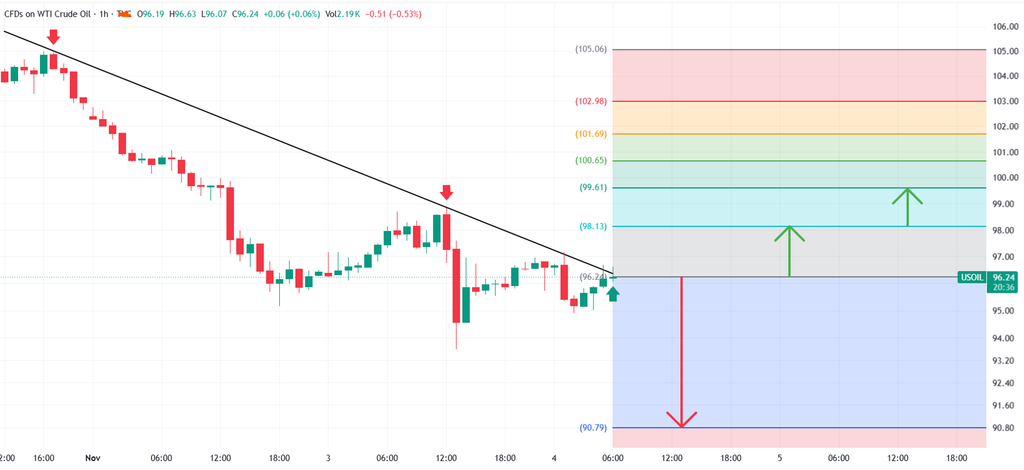
WTI Crude Oil (USOIL) is trading around 96.24, testing key resistance near 96.24 along a descending trendline within a broader downtrend. Resistance lies at 98.13, followed by 99.61 and 100.65. Key support sits at 90.79. A confirmed breakout or breakdown could determine the next major move.
Bearish Scenario:
A sustained rejection from 96.24 or a break below support could expose downside toward 95.00, 93.00 and potentially 90.79.
Bullish Scenario:
A confirmed break above 98.13 could signal a recovery toward 99.61, 100.65 and potentially 101.69.
Set Up:
🔴 SELL: Below 96.24 after confirmation/retest
SL: 98.13
TP: 90.79
RR: Approximately 1:2.9
🟢 BUY: Above 98.13 after confirmed breakout/retest
SL: 96.24
TP: 99.61
RR: Approximately 1:0.8
Apply Risk Management Always.
STOCKS : NVIDIA
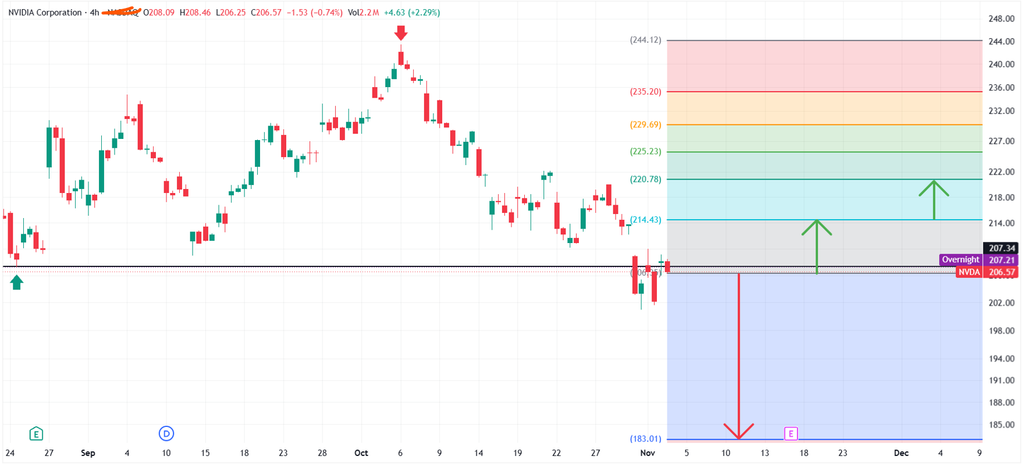
Market Context:
NVIDIA (NVDA) is trading around 206.57, testing key support near 207.34 within a broader downtrend. Resistance lies at 214.43, followed by 220.78 and 225.23. A confirmed breakout or breakdown could determine the next major move.
Bearish Scenario:
A sustained break below 207.34 could expose downside targets at 202.00, 198.00 and potentially 183.01.
Bullish Scenario:
A confirmed break above 214.43 could support a recovery toward 220.78, 225.23 and potentially 229.69.
Set Up:
🔴 SELL: Below 207.34 after confirmation/retest
SL: 214.43
TP: 183.01
RR: Approximately 1:3.4
🟢 BUY: Above 214.43 after confirmed breakout/retest
SL: 207.34
TP: 220.78
RR: Approximately 1:0.9
Apply Risk Management Always.
#MidweekMarketOutlook #ForexTrading #GoldTrading #EURUSD #BitcoinTrading #CrudeOil #NVIDIA #MarketAnalysis #TradingSignals #FundamentalAnalysis #TenTrade