Midweek Market Outlook – 28 / October/ 2026

Midweek markets remain volatile, with gold near $4,042, EUR/USD at 1.11216, Bitcoin around $80,919, WTI crude at $101.43 and NVIDIA at $217.89. For the rest of the week, traders should watch key technical levels, US economic data, interest-rate expectations, geopolitical tensions and oil supply developments for potential market-moving opportunities.
METALS : GOLD
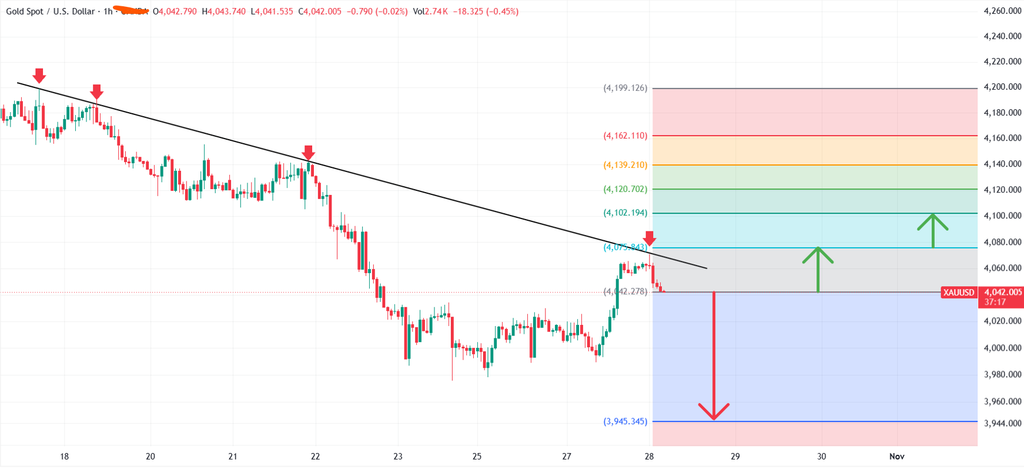
Market Context:
Gold (XAU/USD) is trading around 4,042, testing key support near 4,042 within a broader downtrend. Resistance lies at 4,075, followed by 4,102 and 4,120. A confirmed breakout or breakdown could determine the next major move.
Bearish Scenario:
A sustained break below 4,042 could expose downside targets at 4,000, 3,980 and potentially 3,945.
Bullish Scenario:
A confirmed break above 4,075.843 could support a recovery toward 4,102, 4,120 and 4,139.
Set Up:
🔴 SELL: Below 4,042 after confirmation/retest
SL: 4,075
TP: 3,945
RR: Approximately 1:2.9
🟢 BUY: Above 4,075.843 after confirmed breakout/retest
SL: 4,042
TP: 4,102
RR: Approximately 1:0.8
Apply Risk Management Always.
FOREX : EURUSD
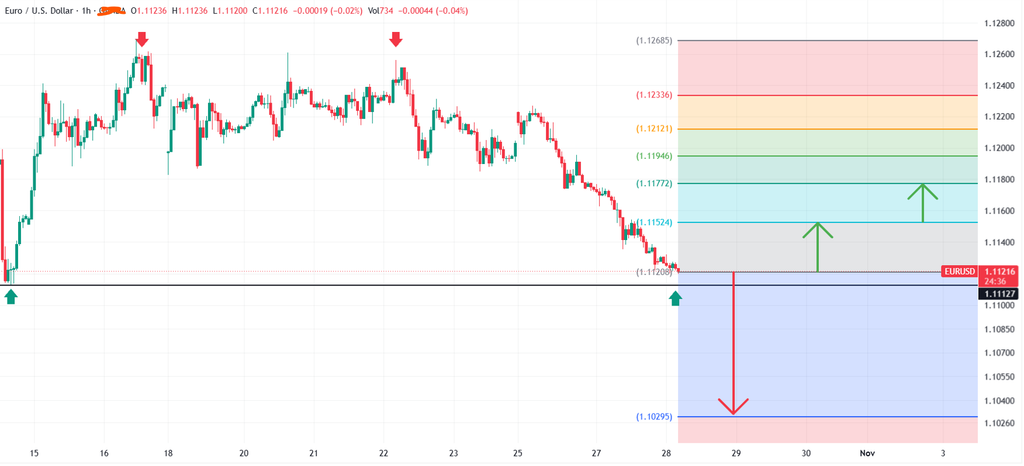
Market Context:
EUR/USD is trading around 1.11216, testing key support near 1.11208 within a broader downtrend. Resistance lies at 1.11524, followed by 1.11772 and 1.11946. A confirmed breakout or breakdown could determine the next major move.
Bearish Scenario:
A sustained break below 1.11127 could expose downside targets at 1.10850, 1.10550 and potentially 1.10295.
Bullish Scenario:
If EUR/USD reclaims 1.11524 and breaks above 1.11772, upside could extend toward 1.11946, 1.12121 and 1.12336.
Set Up:
🔴 SELL: Below 1.11127 after confirmation/retest
SL: 1.11524
TP: 1.10295
RR: Approximately 1:2.1
🟢 BUY: Above 1.11524 after confirmed breakout/retest
SL: 1.11127
TP: 1.11772
RR: Approximately 1:0.6
Apply Risk Management Always.
CRYPTO : BTCUSD
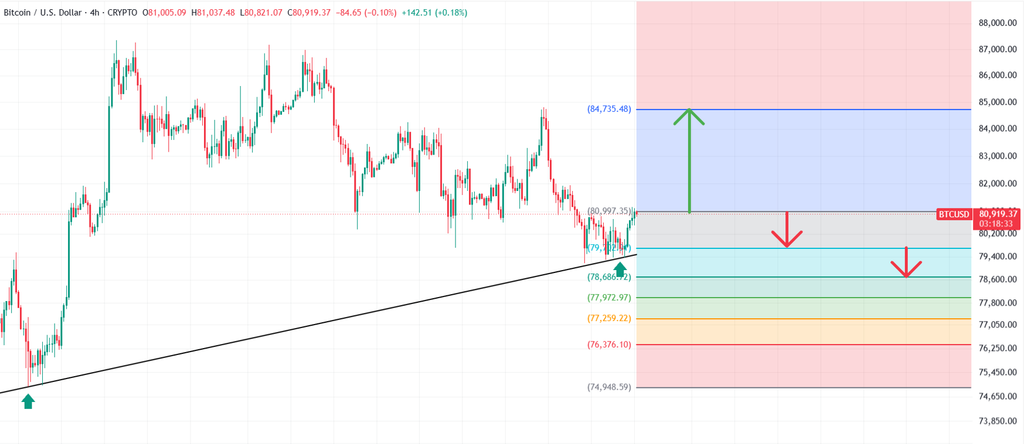
Market Context:
Bitcoin (BTC/USD) is trading around 80,919, testing resistance near 80,998 after rebounding from the 79,700 support zone. A confirmed breakout could open the way toward 84,735, while rejection could expose lower support levels.
Bearish Scenario:
A sustained break below 79,700 could expose downside targets at 78,686, 77,972, 77,259 and potentially 76,376.
Bullish Scenario:
A confirmed breakout and hold above 80,998 could push Bitcoin toward 84,735. Continued bullish momentum may support a further recovery.
Set Up:
🔴 SELL: Below 79,700 after confirmation/retest. SL: 80,998 | TP: 76,376 | RR: approximately 1:2.6
🟢 BUY: Above 80,998 after confirmed breakout/retest. SL: 79,700 | TP: 84,735 | RR: approximately 1:2.9
Apply Risk Management Always.
ENERGY : USOIL
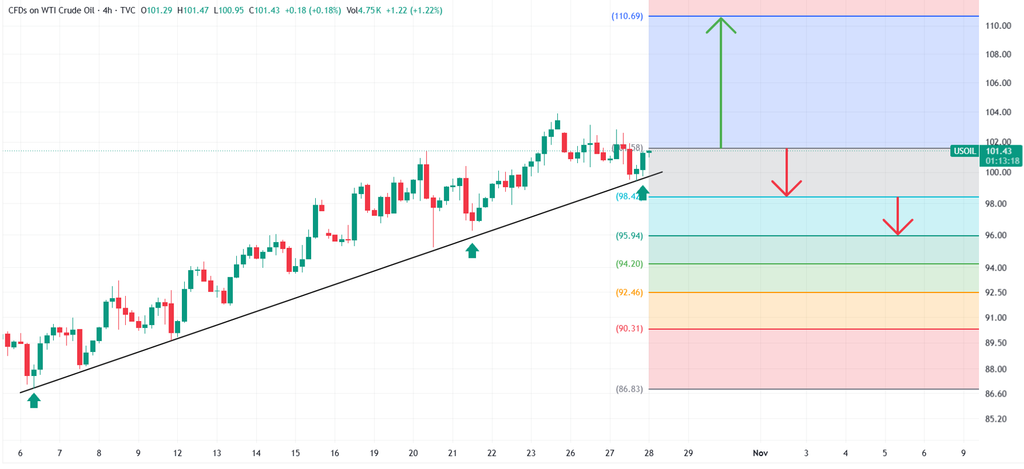
Market Context:
WTI Crude Oil (USOIL) is trading around 101.43, holding above the rising trendline with support near 98.44. Resistance lies around 101.58, followed by 110.69. A confirmed breakout or breakdown could determine the next major move.
Bearish Scenario:
A sustained break below 98.44 could expose downside targets at 95.94, 94.20, 92.46 and potentially 90.31.
Bullish Scenario:
A confirmed breakout above 101.58 could open the way toward 110.69, supported by the broader rising trendline.
Set Up:
🔴 SELL: Below 98.44 after confirmation/retest. SL: 101.58 | TP: 90.31 | RR: approximately 1:2.6
🟢 BUY: Above 101.58 after confirmed breakout/retest. SL: 98.44 | TP: 110.69 | RR: approximately 1:2.9
Apply Risk Management Always.
STOCKS : NVIDIA
Market Context:
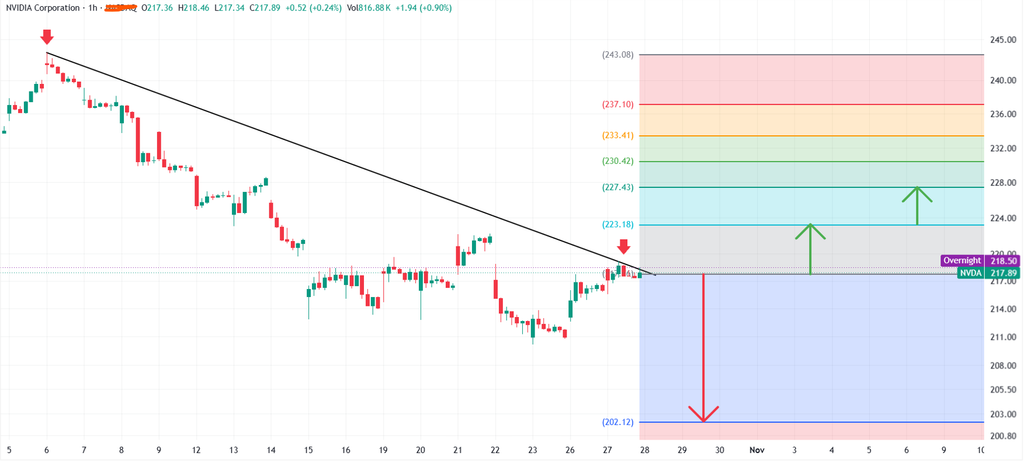
NVIDIA (NVDA) is trading around 217.89, testing key support near 217.50 at the descending trendline resistance. A confirmed breakout above 223.18 could signal a bullish reversal, while a breakdown below 217.50 could expose further downside toward 202.12.
Bearish Scenario:
A sustained break below 217.50 could trigger further downside toward 214.00, 211.00 and potentially 202.12.
Bullish Scenario:
If NVDA holds above 217.50 and breaks through 223.18, upside targets could extend toward 227.43, 230.42 and 233.41.
Set Up:
🔴 SELL: Below 217.50 after confirmation/retest. SL: 223.18 TP: 202.12 RR: 1:2.7
🟢 BUY: Above 223.18 after a confirmed breakout/retest. SL: 217.50 TP: 227.43 RR: 1:0.7
Apply Risk Management Always.