How Traders Read the Markets

Have you ever looked at a trading chart and wondered, “How do traders know when to buy or sell?”
The truth is, traders don’t have a crystal ball. They read the market by studying price, trends, key levels, economic events and market behaviour to identify potential opportunities.
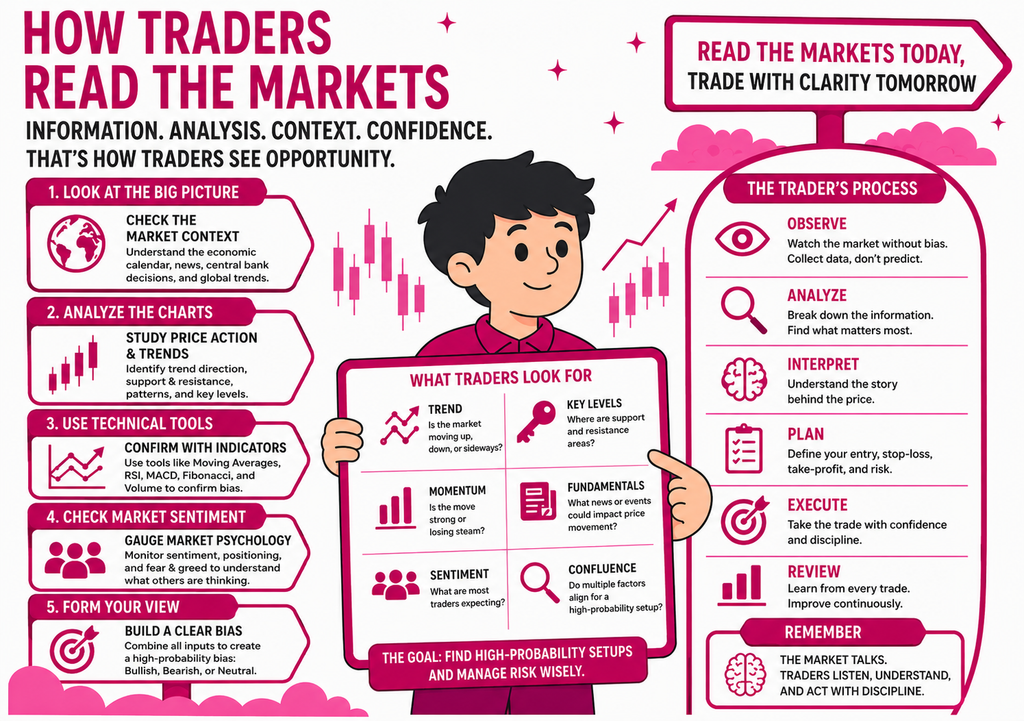
1. They Start With the Trend
One of the first things traders look at is direction.
Is the market generally moving upward, downward or sideways?
For example, imagine EUR/USD has been making higher highs and higher lows. A trader may see this as an uptrend and start looking for potential buying opportunities rather than randomly selling.
It’s like walking up a staircase, you generally expect the next step to be higher unless something changes.
2. They Identify Key Levels
Traders also look for areas where price has previously reacted.
These are often called support and resistance.
Imagine Gold repeatedly falls toward $3,400 and then starts rising again. A trader may consider this an important support area.
If price approaches that level again, the trader watches closely to see whether buyers step in or whether price finally breaks below it.
The level itself isn’t a guarantee, the reaction around it is what matters.
3. They Study Price Behaviour
Charts tell a story through candlesticks and price movements.
For example, if price reaches resistance and forms several candles showing rejection, traders may interpret this as a sign that sellers are becoming active.
On the other hand, a strong breakout above resistance could suggest increasing buying pressure.
Rather than simply asking “Where is price going?”, traders ask:
“What is price doing right now?”
4. They Watch Economic News
Markets don’t move because of technical analysis alone.
Interest-rate decisions, inflation data, employment reports, central-bank speeches and other economic events can create significant price movements.
For example, if the Federal Reserve makes a surprisingly hawkish statement, traders may reassess their expectations for the US dollar, potentially creating movement across USD pairs.
That’s why many traders check the economic calendar before entering a trade.
5. They Look at Different Timeframes
A trader may use the daily chart to understand the bigger picture, the 4-hour chart to identify important levels and the 1-hour chart to look for a potential entry.
Think of it like using Google Maps.
The daily chart shows you the city, the 4-hour chart shows you the neighbourhood and the 1-hour chart helps you find the exact street.
Each timeframe provides a different perspective.
6. They Combine Evidence
Professional market reading isn’t about finding one magical indicator.
A trader might see:
Uptrend + support level + bullish price reaction + favourable economic outlook = potential buying opportunity.
Each piece of information adds context.
But even when everything appears aligned, the trade can still fail.
That’s why analysis should be combined with proper risk management.
The Goal Isn’t to Predict the Future
This is one of the biggest lessons in trading.
Successful traders don’t need to know exactly what the market will do next.
Instead, they build a trading scenario:
“If price reacts this way, I may consider buying. If price breaks this level, my idea may no longer be valid.”
That’s very different from saying:
“EUR/USD will definitely go up.”
The first approach prepares for different outcomes. The second assumes certainty where none exists.
Read the Market, Don’t Chase It
The market is constantly communicating through price action, trends, key levels, volatility and economic developments.
Your job as a trader is not to force the market to do what you want.
It’s to observe, analyse, plan and respond.
Because the best traders aren’t necessarily the ones who can predict every move, they are the ones who can read the market, manage uncertainty and make disciplined decisions.
#TradingAnalysis #ForexTrading #MarketAnalysis #TradingEducation #PriceAction #TechnicalAnalysis #ForexEducation #TradingStrategy #ReadTheMarket #SmartTrading #TenTrade