
Gold at $5,000: Structural Strength and Strategic Opportunities in Consolidation
Gold continues to demonstrate exceptional strength. Following the easing of geopolitical tensions and the improvement in market sentiment triggered by the establishment of a provisional framework for dialogue regarding the Greenland agreement, prices experienced a moderate pullback. However, this correction was brief and shallow, and the bullish trend quickly resumed, pushing gold close to the $5,000 per troy ounce level.
This price behavior confirms that dominant trend remains clearly bullish, supported by both technical and fundamental drivers. That said, $5,000 represents a major psychological and technical level, which may act as a temporary barrier. While previous resistance zones were broken with relative ease, this round-number level could generate short-term consolidation or a controlled pullback.
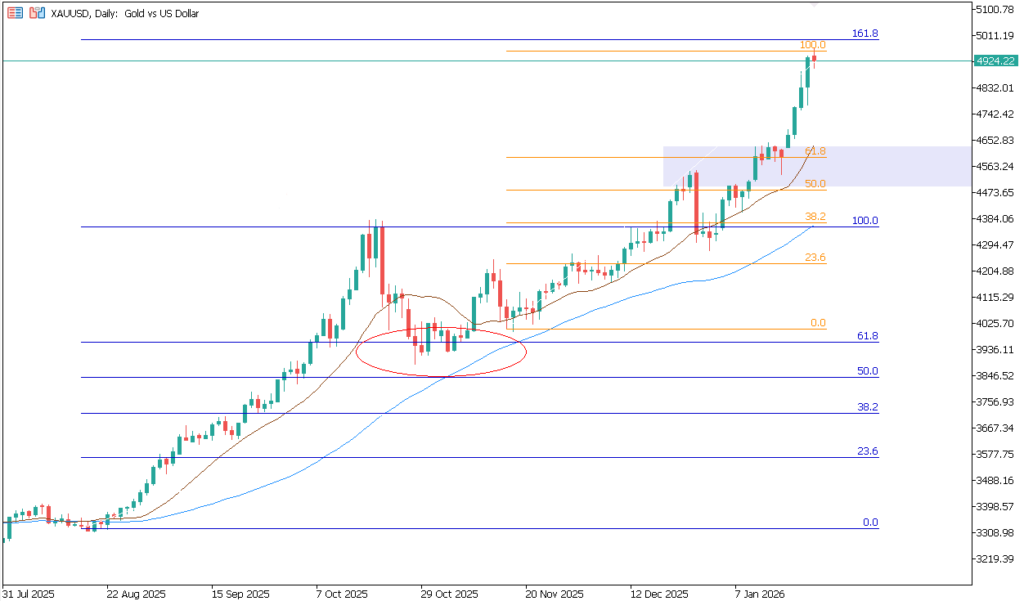
XAUUSD chart, January 23, 2026. Source: TenTrade.com
Technical Analysis: Market Structure, Fibonacci, and Key Zones
From a technical perspective, gold’s market structure remains exceptionally clean and well-defined.
Applying Fibonacci retracements to the bullish impulse that lifted price from the $3,300 area to the $4,400 high, we observe that the subsequent correction found precise support at the 0.618 Fibonacci retracement, a level often associated with trend continuation. From that support zone, gold launched a powerful new rally, reaching near the 1.618 Fibonacci extension, which coincides almost perfectly with the $5,000 psychological level.
This technical confluence reinforces the importance of the $5,000 area as a potential pause, consolidation, or correction zone.
Now, if a correction does occur from these levels, it becomes especially valuable to analyze Fibonacci retracements applied to the most recent bullish impulse. In this case, the 0.618 retracement aligns closely with the previous swing high around $4,600, which was reached just before the so-called “mini Greenland crisis.”
This creates a highly relevant technical confluence:
- The $4,600–$4,650 zone represents:
- A former major high
- The 0.618 Fibonacci retracement of the last impulsive leg
- A key intermediate psychological level
As a result, if gold pulls back from $5,000, the $4,600–$4,650 area stands out as a strategically and technically attractive zone for positioning. Such confluence zones often attract institutional buying interest, increasing the probability of price stabilization and trend continuation.
Correction or Immediate Breakout?
Does this mean a correction is inevitable at $5,000? The honest answer is no one can know with certainty. In strong bull markets, key technical levels can be surpassed rapidly, especially when momentum and fundamentals remain firmly supportive.
However, what can be stated with high confidence is that any controlled correction from these levels would likely represent a new buying opportunity, rather than a signal of structural weakness.
Consolidation as a Constructive Phase
Consolidation phases and moderate pullbacks serve an essential market function. They reduce overbought conditions, flush out weak hands, and rebuild technical foundations for further advances.
In a structurally bullish environment, consolidation should be viewed as preparation, not exhaustion.
Fundamentals: The Bullish Drivers Remain Fully Intact
Beyond technicals, the fundamental forces driving gold higher remain firmly in place:
- Structural depreciation of the US Dollar, driven by excessive debt and persistent fiscal deficits
- Sustained central bank gold purchases, aimed at reserve diversification and reduced reliance on fiat currencies
- Lower interest rate expectations and easier monetary policy, which favor real assets
- Ongoing geopolitical and financial uncertainty, supporting long-term safe-haven demand
As long as these conditions persist, gold’s long-term bullish bias remains firmly intact.
Final Thoughts
Gold’s advance toward $5,000 per ounce marks a major milestone in this bull cycle. While this level may temporarily slow momentum or trigger consolidation, it does not change the dominant upward trend.
Should a correction unfold, the $4,600–$4,650 zone emerges as a high-probability technical and strategic area for positioning, offering attractive risk-reward dynamics.
With a solid technical structure and powerful macroeconomic support, gold appears well positioned to continue shining over the coming months and years.