Prospek Pasar Mingguan: 16–20 November 2026

Pendahuluan
Last week, financial markets delivered mixed performances as the U.S. Dollar Index (DXY) strengthened 1.1% to 103.41, while Gold plunged 4.6% to $3,886.30 and Bitcoin dropped 9.9% to $68,249. Oil also declined 2.5% to $88.56, sementara ekuitas AS pulih, dengan S&P 500 naik 2.5%. This week, attention shifts to Canada’s CPI, Penjualan Ritel AS, Risalah FOMC, laporan laba kuartal 3 Nvidia, persediaan minyak mentah, dan kedaluwarsa opsi Bitcoin bernilai $1.8 billionDengan ekspektasi suku bunga, inflasi, ketegangan geopolitik, dan valuasi sektor teknologi yang mendorong sentimen, para trader sebaiknya bersiap menghadapi peningkatan volatilitas di pasar forex, logam, energi, mata uang kripto, dan saham saat level-level penting diuji.
Rekap Pasar Pekan Lalu
Forex:
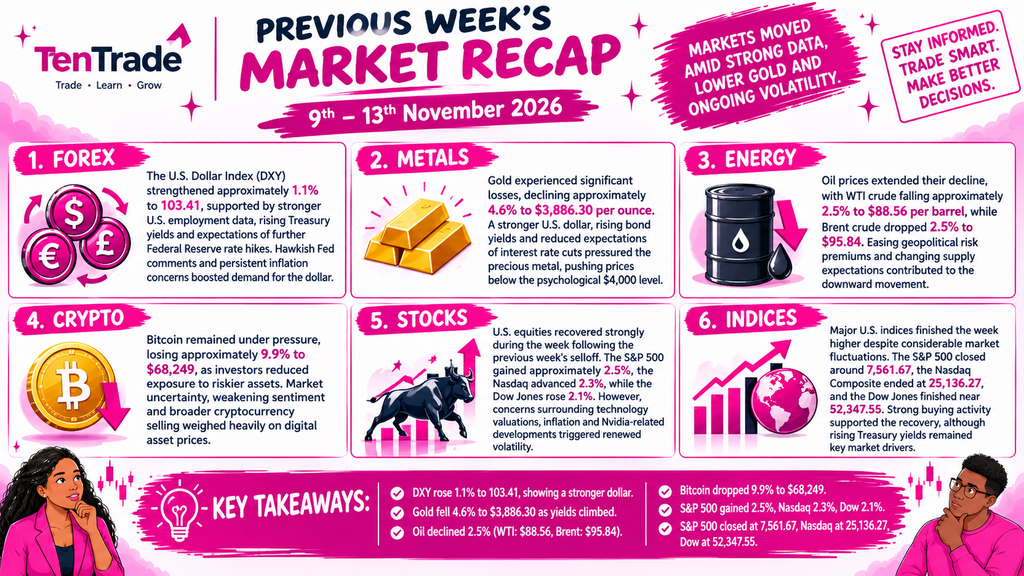
The U.S. Dollar Index (DXY) strengthened approximately 1.1% to 103.41, supported by stronger U.S. employment data, rising Treasury yields and expectations of further Federal Reserve rate hikes. Hawkish Fed comments and persistent inflation concerns boosted demand for the dollar.
Logam:
Gold experienced significant losses, declining approximately 4.6% to $3,886.30 per ounce. A stronger U.S. dollar, rising bond yields and reduced expectations of interest rate cuts pressured the precious metal, pushing prices below the psychological $4,000 level.
Energi:
Oil prices extended their decline, with WTI crude falling approximately 2.5% to $88.56 per barrel, while Brent crude dropped 2.5% to $95.84. Easing geopolitical risk premiums and changing supply expectations contributed to the downward movement.
Kripto:
Bitcoin remained under pressure, losing approximately 9.9% to $68,249, as investors reduced exposure to riskier assets. Market uncertainty, weakening sentiment and broader cryptocurrency selling weighed heavily on digital asset prices.
Saham:
Saham AS pulih kuat selama minggu setelah aksi jual pada minggu sebelumnya. S&P 500 naik sekitar 2.5%, Nasdaq naik 2,3%, sementara Dow Jones meningkat 2,1%. Namun, kekhawatiran seputar valuasi teknologi, inflasi, dan perkembangan terkait Nvidia memicu volatilitas baru.
Indeks: Indeks utama AS mengakhiri pekan lebih tinggi meskipun terjadi fluktuasi pasar yang cukup besar. S&P 500 ditutup di sekitar 7,561.67, the Nasdaq Composite ended at 25,136.27, and the Dow Jones finished near 52,347.55. Strong buying activity supported the recovery, although rising Treasury yields and interest rate expectations remained key market drivers.
Peristiwa Penting Minggu Ini:
FOREX : USDCAD
USD/CAD is likely to experience volatility this week, driven primarily by Canada’s CPI on Monday, diproyeksikan di 3.2% year-on-year versus 3.1% previously and core median inflation at 2.0% versus 1.9%; stronger inflation could support the CAD and push USD/CAD lower, while weaker figures could lift the pair. On Tuesday, U.S. Retail Sales, diproyeksikan di 0.2% versus 0.8% previously, will influence dollar demand, while Wednesday’s FOMC Minutes could strengthen the USD if policymakers signal a hawkish outlook. Friday’s Canadian Retail Sales, expected at 0.7% versus 1.2% previously, seiring dengan pergerakan harga minyak mentah, akan memberikan arah tambahan bagi loonie.
USDCAD
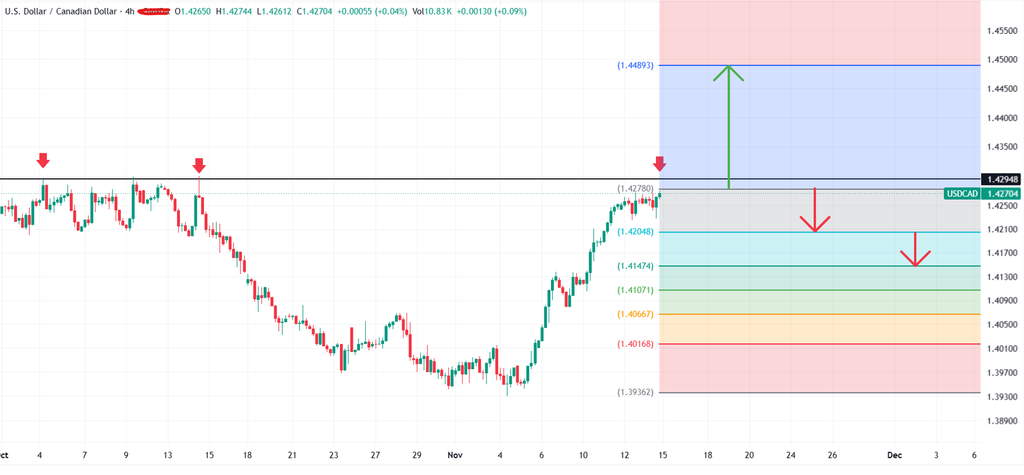
USDCAD is trading around 1.4270, approaching a key resistance zone between 1.4278 and 1.4295 after a strong bullish recovery. A sustained breakout and hold above 1.4295 could support a BUY toward 1.4489, with SL around 1.4205 and an approximate risk-to-reward ratio of 1:2.2. However, rejection from the 1.4278–1.4295 resistance zone could trigger a SELL toward 1.4205, followed by 1.4147, 1.4107 and 1.4067, with SL above 1.4320. A confirmed breakout above 1.4295 strengthens the bullish outlook, while a rejection followed by a sustained break below 1.4205 could accelerate selling pressure toward lower support levels.
Selalu terapkan manajemen risiko.
LOGAM : XAUUSD ( EMAS )
Gold (XAUUSD) is likely to remain volatile this week, with the main drivers being Federal Reserve policy expectations, U.S. economic data, the dollar and Treasury yields. Monday’s Fed Chair Warsh speech could influence rate expectations, while Tuesday’s U.S. Retail Sales, forecast at 0.2% versus 0.8% previously and Core Retail Sales at 0.4% versus 0.9%, could strengthen gold if results disappoint. Wednesday’s FOMC Meeting Minutes (19:00 GMT) will be crucial for clues about a possible December rate hike, currently priced at approximately 85–90% probability. Thursday’s Jobless Claims, forecast at 199K versus 200K, and Friday’s Consumer Sentiment, expected at 52.1 versus 51.0, alongside inflation expectations previously at 4.3%, could trigger further volatility. A stronger dollar and rising yields may push gold lower, while weaker U.S. data and dovish Fed signals could support a recovery.
XAUUSD ( EMAS )
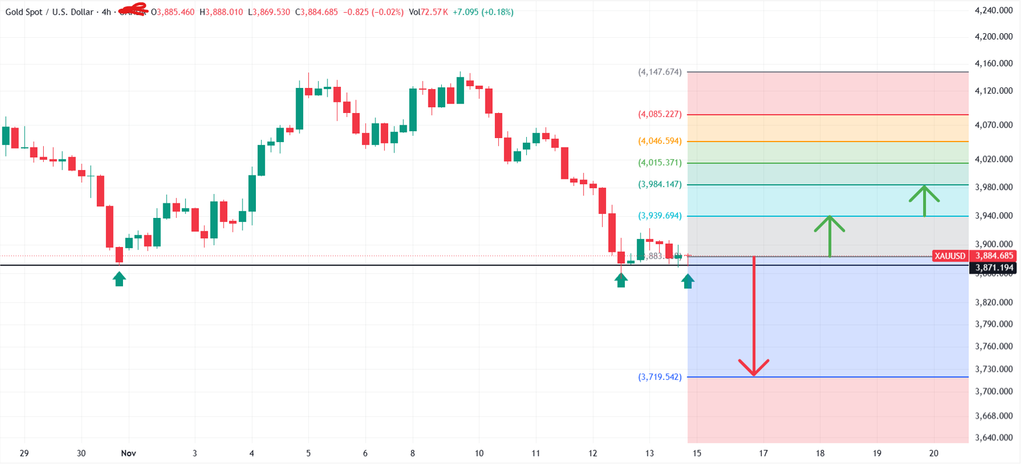
Gold (XAU/USD) is trading around 3,884.69, testing key support near 3,871.19 after a strong bearish move. A sustained break and hold above 3,939.69 could support a BUY toward 3,984.15, 4,015.37 and 4,046.59, with SL around 3,871.19 and RR around 1:1.2. A rejection from the 3,939.69–3,984.15 resistance zone could trigger a SELL toward 3,871.19, with further downside toward 3,719.54, while SL sits around 3,984.15. A confirmed breakout above 4,046.59 would strengthen the bullish outlook, while a sustained break below 3,871.19 could increase selling pressure toward 3,719.54.
Selalu terapkan manajemen risiko.
ENERGI : USOIL
USOIL is likely to remain volatile this week, with prices influenced by U.S. crude inventory data, Middle East tensions, global supply expectations and demand concerns. WTI closed around $88.56 per barrel, down approximately 2.5% last week, as U.S. crude inventories unexpectedly increased by 9 million barrels, against expectations of a 1-million-barrel decline. Tuesday’s API inventory report and Wednesday’s EIA crude stock report will be major catalysts, with further inventory builds potentially pushing prices lower. Meanwhile, continued tensions involving Iran and shipping through the Selat Hormuz dapat mendukung harga minyak, sementara surplus pasokan global yang diproyeksikan IEA sebesar sekitar 1.7 million barrels per day dapat meningkatkan tekanan jual. Dolar AS, data produksi industri hari Selasa dan Risalah FOMC hari Rabu juga akan memengaruhi sentimen pasar.
USOIL
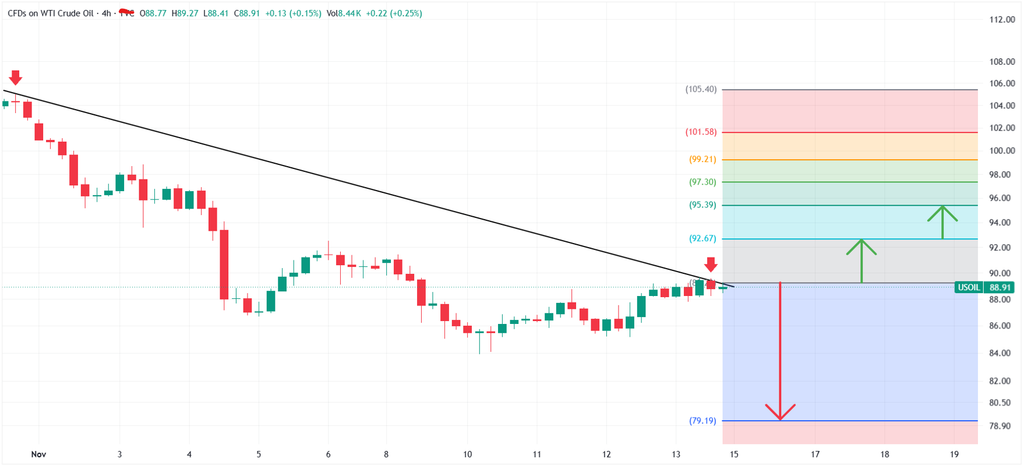
WTI Crude Oil (USOIL) is trading around 88.91, testing key resistance near 89.00 along the descending trendline. A sustained break and hold above 89.00 could support a BUY toward 92.67 and 95.39, with SL around 88.00 and RR around 1:3.7. A rejection from the 89.00–92.67 resistance zone could trigger a SELL toward 85.00 and 79.19, with SL around 92.67 and RR around 1:2.6. A confirmed breakout above 92.67 would strengthen the bullish outlook, while a sustained break below 88.00 could increase selling pressure toward 85.00 and 79.19.
Selalu terapkan manajemen risiko.
KRIPTO : BTCUSD ( BITCOIN )
Bitcoin and the broader crypto market are expected to remain highly volatile this week, driven by Federal Reserve policy, U.S. economic data, institutional ETF flows and technology stocks. On Monday, Fed Chair Kevin Warsh’s speech could influence interest-rate expectations, while Tuesday’s U.S. Retail Sales, diproyeksikan di 0.2% versus 0.8% previously, and Nvidia’s earnings around 21:20 GMT could affect risk appetite. Wednesday’s FOMC Minutes at 19:00 GMT will be crucial for clues about a possible December rate hike, while Thursday’s Jobless Claims, forecast at 199K versus 200K, will provide further economic signals. Friday’s expiry of approximately 28,300 BTC options worth $1.8 billion could trigger additional volatility. Meanwhile, continued Bitcoin ETF outflows of approximately $1.065 billion last week and extreme fear sentiment at 13/100 could maintain selling pressure; weaker U.S. data, renewed ETF inflows and improved investor confidence could support a recovery.
BTCUSD
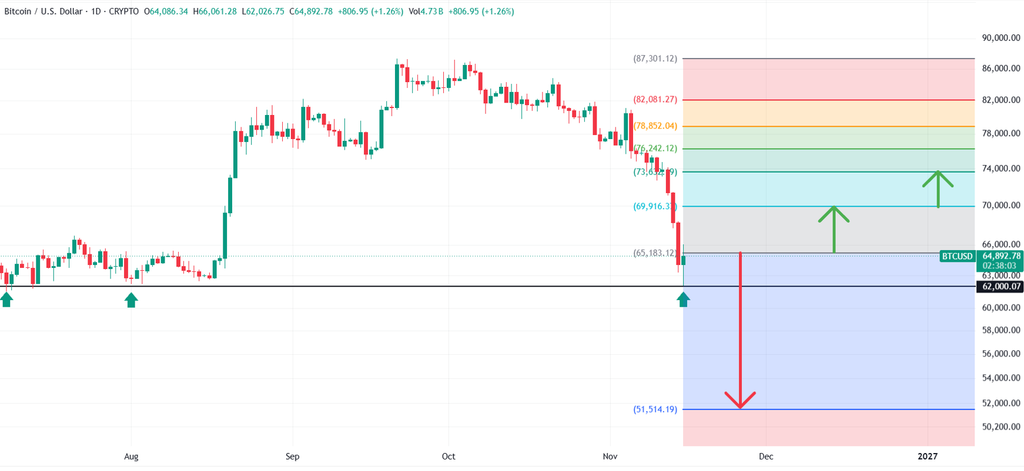
Bitcoin (BTC/USD) diperdagangkan di sekitar 64,893, menguji support utama di dekat 62,000 after a sharp bearish move. A sustained break and hold above 65,183 dapat mendukung BELI menuju 69,916, 73,654 dan 76,242, dengan SL sekitar 62,000 dan RR sekitar 1:1.9. A rejection from the 65,183–69,916 resistance zone could trigger a JUAL menuju 62,000, with further downside toward 51,514, sementara SL sits around 69,916. A confirmed breakout above 69,916 would strengthen the bullish outlook, while a sustained break below 62,000 could increase selling pressure toward 58,000 dan 51,514.
Selalu terapkan manajemen risiko.
SAHAM : NVIDIA
NVIDIA and the broader U.S. stock market are likely to experience significant volatility this week , with the main catalyst being NVIDIA’s Q3 earnings on Tuesday, 17th November, where revenue expectations stand around $109.2 billion and EPS forecasts near $2.49; stronger results and upbeat AI demand guidance could support technology stocks, while disappointing figures could trigger a broader selloff. The options market is pricing an approximately ±8.8% move in NVIDIA shares around earnings. Tuesday’s U.S. Retail Sales, forecast at 0.2% versus 0.8% previously, Wednesday’s FOMC Minutes, and a 91.7% market-implied probability of a December 25-basis-point Fed rate hike will also influence investor sentiment. Additionally, earnings from Home Depot, Target and Walmart akan memberikan wawasan tentang belanja konsumen, sementara imbal hasil Treasury, valuasi AI, dan aksi ambil untung di sektor teknologi tetap menjadi penggerak utama pasar.
NVIDIA
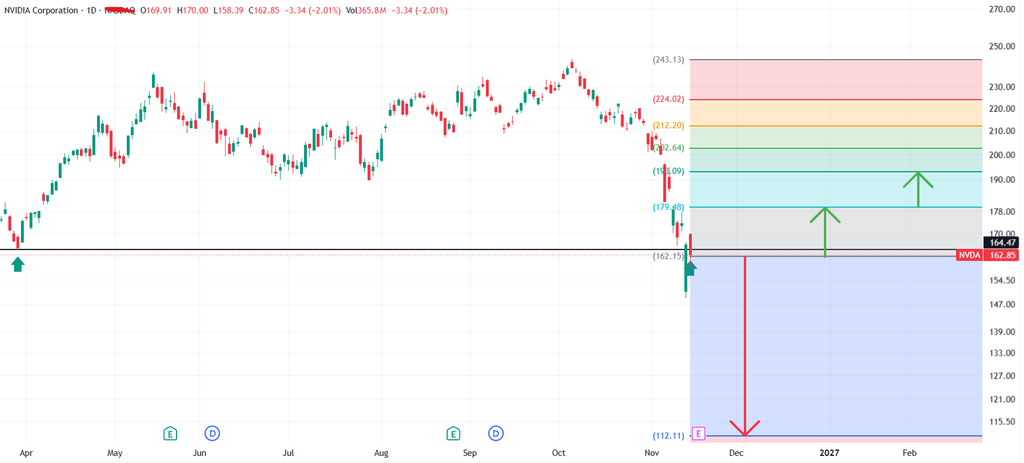
NVIDIA (NVDA) is trading around 162.85, testing key support near 162.15 after a sharp bearish move. A sustained break and hold above 179.48 could support a BUY toward 193.09, 202.64 and 212.20, with SL around 162.15 and RR around 1:3.1. A rejection from the 179.48–193.09 resistance zone could trigger a SELL toward 162.15, with further downside toward 112.11, while SL sits around 193.09. A confirmed breakout above 202.64 would strengthen the bullish outlook, while a sustained break below 162.15 could increase selling pressure toward 147.00, 133.00 and 112.11.
Selalu terapkan manajemen risiko.